KWL Chart
A KWL chart tracks what students Know, Want to know, and have Learned. Download the free printable template, or see examples for science, history and reading.
What is a KWL Chart?
A KWL chart is a teaching strategy that helps students organize their thoughts before, during, and after a learning exercise. First, students identify what they know about a topic. Then, they think about what they want to research or learn. After the lesson, they then reflect on what they have learned. A KWL chart is useful for both individuals and groups as formative assessment and for visible thinking strategies.
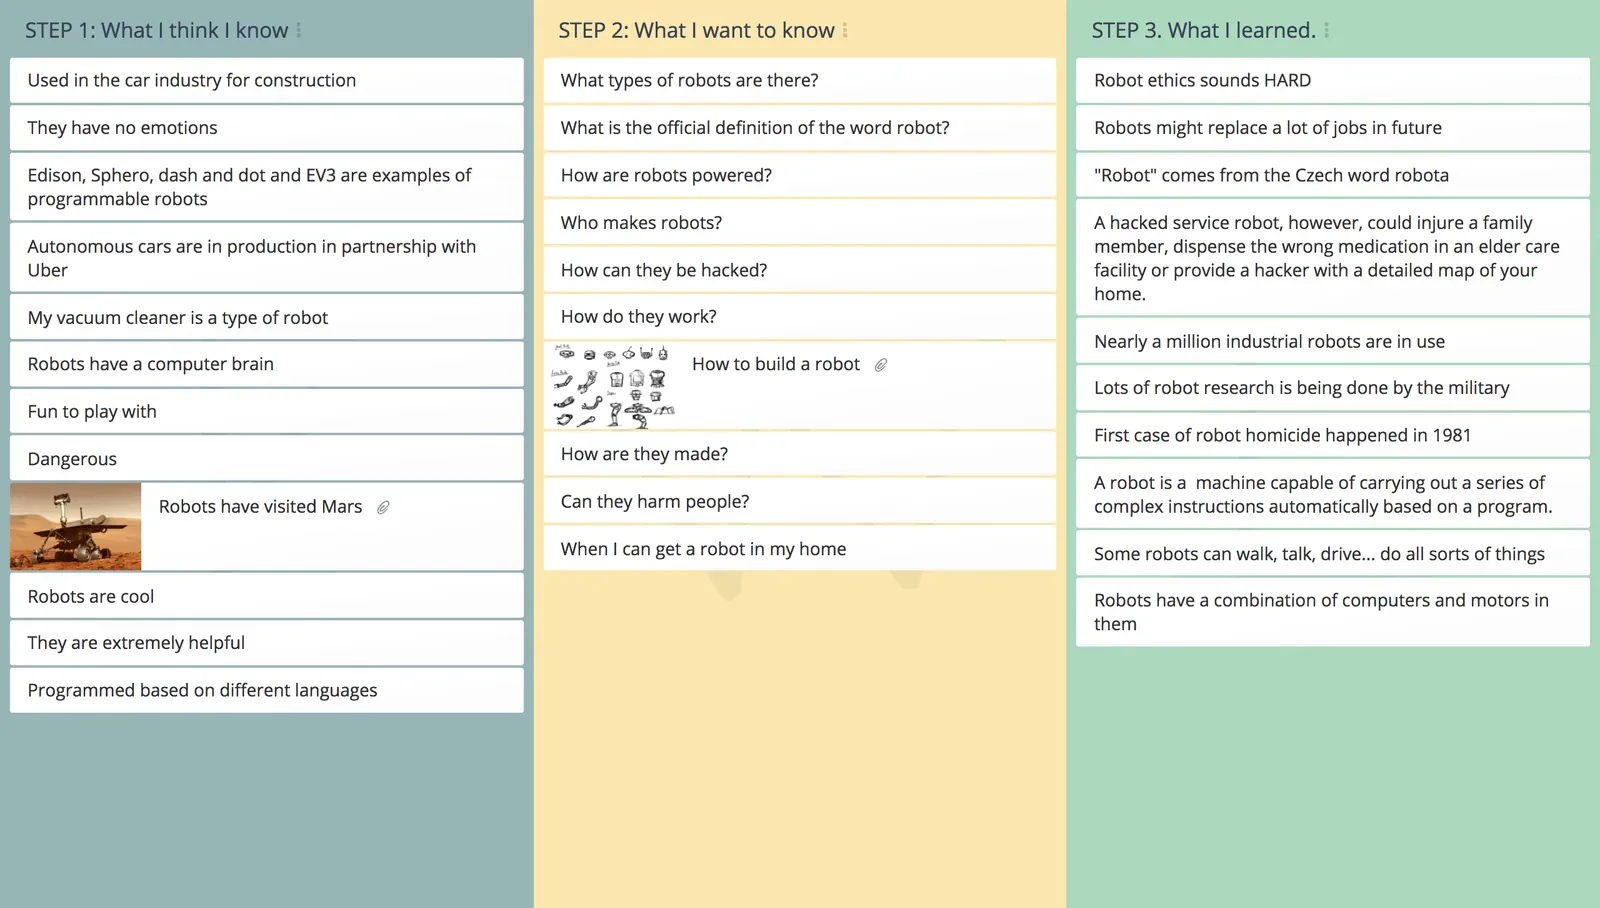
Teachers can use this technique to gather information for creating customized, student-specific lesson plans while still linking to a curriculum or organizational learning goals. The information is displayed visually enabling both students and teachers to keep track of progress.
The chart focuses on three areas:
- K – What students already KNOW about a topic?
- W – What students WANT to learn or find out?
- L – What students have LEARNED about the topic after taking action?
You can also extend the basic KWL chart to include additional items like asking what actions they can take with their new knowledge, what new questions have come up and what other reflections they may have. The KWHLAQ chart is a popular extension that does exactly this.
Key takeaways
- A KWL chart is a three-column graphic organizer that tracks what students Know, Want to know, and have Learned.
- Fill in K and W before the lesson, then complete L afterwards and compare the W and L columns to see which questions still need answering.
- It works for a whole class or team, doubling as a diagnostic and formative assessment and a visible-thinking tool.
- Extend it to a KWHLAQ chart when you also want to capture How to research, how to Apply learning, and new Questions.
- Work on paper or on screen: download the free printable KWL chart below, or run the same three columns live with your class.
Free printable KWL chart (PDF)
If you would rather work on paper, download the blank chart and hand it out before the lesson. There are two versions, both free and with no sign-up:
- Printable blank KWL chart. Two pages: an open three-column chart, and the same chart with writing lines for younger students. Ready to photocopy for a class.
- Editable KWL chart. The same grid with form fields, so you can type into it before printing.
Both print on US Letter or A4.
Download the printable (PDF)Download the editable (PDF)Print one per student for individual work, or put a copy on each table for small groups. Paper suits the K and W columns at the start of a lesson, though it does mean collecting the sheets back in to see what the class wrote. Running the same three columns online keeps every response in one place, and every participant contributes from their own device at once.
5 reasons to run the KWL chart online instead of printing it
Print the chart if paper suits the lesson. What changes when you run it online is not the chart itself but what you can do with it afterwards, and five things in particular are worth knowing before you reach for the photocopier.
- Save the paper and save the collating. There is nothing to photocopy, hand out, or chase up at the end, and no pile of sheets to type up afterwards. When the lesson is done the finished chart exports to PDF, CSV or Excel, so the class’s answers are already in a file you can mark, share, or attach to a report.
- See each student, not just the class. As students type, their answers land on one board, and individual student reports show how each one took part. That is what turns the chart into a formative assessment you can act on: the reports show who is holding a misconception in the K column, whose question is worth teaching to, and who did not get anything down.
- The quiet students get their questions in too. Set the brainstorm style to individual and students write into the K and W columns on their own, seeing only their own ideas first, so the loudest answer never sets the pattern for the room. When you open the results up, a student with the same question can add it too, so the W column arrives ordered by how many students share each question and you can answer the most-asked one first. Choose full, partial or no anonymity to suit the class: on partial, students write without their classmates seeing who wrote what, while you still can.
- The chart is still there next term. Every map is saved, so a KWL does not end up in the recycling on Friday afternoon. Duplicate it for your next class or your next topic, or import the earlier ideas into a new map so students read back what they wrote before the lesson and say whether they would still write it now. Paper rarely survives long enough for that, and a student’s own words are far harder to argue with than a summary.
- Students join in seconds, with no accounts to set up. They open a link or code on whatever device is in the room: no download, no install, and nothing for you to set up for students who do not have accounts. It works across modern browsers and devices, so a trolley of borrowed Chromebooks and a few phones all reach the same chart, and you can sync every screen to the same step when you want the class looking at the same thing.
Why do a KWL Chart?
The KWL Chart is a simple but effective teaching pedagogy which puts the student at the center of inquiry based learning. The chart:
- Provides teachers with valuable information as to what students already know about a given topic. (diagnostic assessment).
- Builds collective learning by helping students to learn from each other (peer to peer learning).
- Enables teachers to create more enjoyable lesson plans that address the interests, questions, and needs of the students
- Increases motivation and involvement by activating the students’ prior knowledge.
- Creates interest and curiosity and encourages students to expand their ideas beyond the lesson or training provided in the classroom environment.
- Presents an opportunity for students to consolidate their learning by reflecting on what they have learned and sharing this with others.
KWL chart examples
Three worked examples, one each for science, history and reading. In every case the K and W columns are filled in before the lesson, and the L column afterwards.
Science: the water cycle
| Know | Want to know | Learned |
|---|---|---|
| Rain comes from clouds | Where does the water go after it rains? | Water evaporates, condenses into clouds, then falls as precipitation |
| Puddles dry up in the sun | Why does the sea not overflow? | The same water moves round a closed cycle, so the total does not change |
| Snow is frozen water | Does the water we drink get reused? | Groundwater and transpiration from plants both feed the cycle |
History: the causes of a local strike
| Know | Want to know | Learned |
|---|---|---|
| There was a strike at the mill in the 1890s | What were the workers asking for? | They wanted shorter hours, not higher pay |
| Some workers lost their jobs | Who decided how it ended? | An arbitrator appointed by the state settled it |
| The mill closed eventually | Did the strike cause the closure? | The closure came twenty years later, for unrelated reasons |
Reading: before and after a novel
| Know | Want to know | Learned |
|---|---|---|
| The story is set during a war | Who is telling the story, and why? | The narrator is unreliable, and that is the point |
| The main character is a child | Does she understand what is happening? | She reports more than she understands, which is how the reader learns |
| It is based on real events | Which parts really happened? | The setting is real, the family is invented |
In each case the Learned column answers some questions and leaves others open. Comparing the W and L columns at the end shows what still needs work, which is the most useful part of the exercise.
KWL charts by age group
Preschool and kindergarten
Keep it oral and pictorial. You write or draw in the columns while the class talks, and two or three entries per column is plenty. “Want to know” works better phrased as “I wonder”, which is why some early-years classrooms use a Know, Wonder, Learned chart instead.
Elementary
Learners can write their own entries by this stage, usually starting in pairs before sharing with the class. This is the age where the W column starts producing genuinely good questions, so leave time for it and resist tidying them up.
Middle school and above
Use the chart to expose misconceptions rather than to warm up. Anything in the K column that turns out to be wrong is the most valuable thing on the page, so return to it explicitly at the end instead of quietly moving on. At this level, the KWHLAQ variation below usually earns its extra columns.
KWL chart variations
| Variation | The columns | Best for |
|---|---|---|
| KWL | Know, Want to know, Learned | The default. Any age, any subject. |
| KWHL | Know, Want to know, How I will find out, Learned | When you want learners to plan their research, not just receive it. |
| KWHLAQ | Know, Want to know, How, Learned, Apply, Questions I still have | Inquiry-based and flipped classrooms. See our KWHLAQ template. |
| KWLQ | Know, Want to know, Learned, Questions remaining | A lighter way to keep the inquiry open at the end. |
| KLEWS | Know, Learning, Evidence, Wonderings, Scientific principles | Science, where a claim needs evidence behind it. |
| TWLH | Think, Want to know, Learned, How we know | Shifts the first column from “know” to “think”, which lowers the stakes on being wrong. |
| Know, Wonder, Learned | Know, Wonder, Learned | Early years, where “wonder” is easier to answer than “want to know”. |
If the K column keeps producing confident wrong answers, move to TWLH. If learners can never say how they know something, move to KLEWS. Print extra sheets with the additional columns, or add the columns in GroupMap.
KWL Chart template
The KWL chart template is three columns, one for each stage of the lesson:
| Column | What goes here | When |
|---|---|---|
| K: what I Know | Prior knowledge the student already has about the topic | Before the lesson |
| W: what I Want to know | Questions and things the student wants to find out | Before the lesson |
| L: what I Learned | New knowledge captured after the lesson, answering the W column | After the lesson |
You can take this layout two ways: the free printable KWL chart for a paper handout, or the online template below to fill in the same columns with the whole class at once.
What I KNOW
Information about what the students already know.
Complete before planning and delivery of the lesson.
What I WANT to know
Information about what the students want to know.
Complete before planning and delivery of the lesson.
What I LEARNED
Information about what the students learned.
Complete after the lesson.
Who should use a KWL chart?
This technique adds structure to the learning process. A KWL chart is useful for teachers, trainers, students, and researchers who:
- Are about to start a new topic
- Looking to implement student centered teaching strategies
- Need evidence of diagnostic and formative assessments
- Want to reduce paperwork
- Introduce ICT into their curriculum in a meaningful way
Related templates
- KWHLAQ Chart: the extended KWL for inquiry-based and flipped classrooms
- Group Mind Mapping: brainstorm and connect ideas visually
- SMART Goals: turn learning intentions into clear goals
- What, So What, Now What: structured reflection after an activity
References
- Ogle, Donna. 1986. “KWL: A Teaching Model that Develops Active Reading of Expository Text.” The Reading Teacher. 39, 6: 564- 570.
- KWL table: overview of the know, want to know, learned structure and its classroom use.
Save effort, time and money with GroupMap
GroupMap offers more than just an online digital whiteboard. Its innovative platform is designed to enhance the quality of your team’s decisions. With features that prevent bias and keep facilitation simple, GroupMap makes sure no single voice dominates and keeps conversations productive and inclusive. Its intuitive interface is easy for anyone to use, and its scalable design supports small teams and large groups whether they are face to face or around the globe. Customizable templates and workflows keep discussions focused on objectives, helping you drive actionable outcomes each and every time.
Frequently asked questions
What is a KWL chart?
What does KWL stand for?
How do you fill out a KWL chart?
What is a KWL chart example?
Is there a free printable KWL chart?
Can I use a KWL chart without printing it?
What can I use instead of a KWL chart?
What is the KWHLAQ chart, and how does it extend KWL?
How to run it in GroupMap

Set topic
Define the topic, scope and objective of the KWL chart.
Brainstorm (KW)
Capture everything you know and want to know about the topic.

Review (KW)
Review results, discuss and prioritize.

Run lesson
Deliver the lesson.

Reflect (L)
As a group, capture everything you learned about the topic.
Ready to get everyone on the same page?
Start a free GroupMap and turn your next discussion into clear, shared decisions.