Perceptual Map
Perceptual Maps are useful focus group tools capturing relative perceptions of brands, products or ideas. Get started with our Perceptual Map Template.
What is a Perceptual Map?
A perceptual map is a visual representation of the perceptions of customers or potential customers about specific attributes of an organization, brand, product, service, or idea.
This diagrammatic technique (perceptual mapping) asks participants to place products relative to one another along 2 or more axis.
The resulting map shows how consumers see the strengths of competing products in a particular market.
Create a Perceptual Map in GroupMapPerceptual maps are also referred to as position maps and market maps. Examples include:
- Quality vs Price
- Functionality vs Price
- Healthiness vs Tastiness
- Price vs Performance
- Price vs Safety & Reliability
Tips to facilitate Perceptual Map
- A good way to help show the relative positions is to use a central brand as the mid point of the axis.
- Individual positioning of each idea allows you to see where there might be differences in perceived opinions.
- This is a great activity to be used by both potential or current customers so that you are capturing their perspectives of your brand.
- You can add additional action items if you want to “find your place” in the market and to talk about strategies that might be used to help change the shifts in perception.
Why create a Perceptual Map?
Understanding what your customers think about you and your competitors is crucial to your success. A perceptual map helps organizations to:
- Understand the thoughts and behaviors of consumers.
- Gain insight into their competition.
- Track market trends.
- Identify gaps in the market.
Use it for:
- Environmental scanning prior to planning.
- Developing marketing, branding, and positioning strategies.
- Informing product and service development initiatives.
- Tracking the performance of new products.
- Identifying the extent of damage to products on the decline.
- Regular reviews to determine market changes and new trends.
Who should you use Perceptual Maps?
Perceptual maps are useful for any organization that wants to identify gaps in the market, monitor their own products, or look for potential partners or takeover/merger targets.
Perceptual Map template
The most common format for a perceptual map template is a two-dimensional chart where the horizontal and vertical axes represent different attributes that you rate on a scale e.g., Low to High. The map is straightforward and simple to construct and interpret.
Examples of attributes used on a perceptual map template include: price, quality, performance, packaging, size, features, safety and reliability.
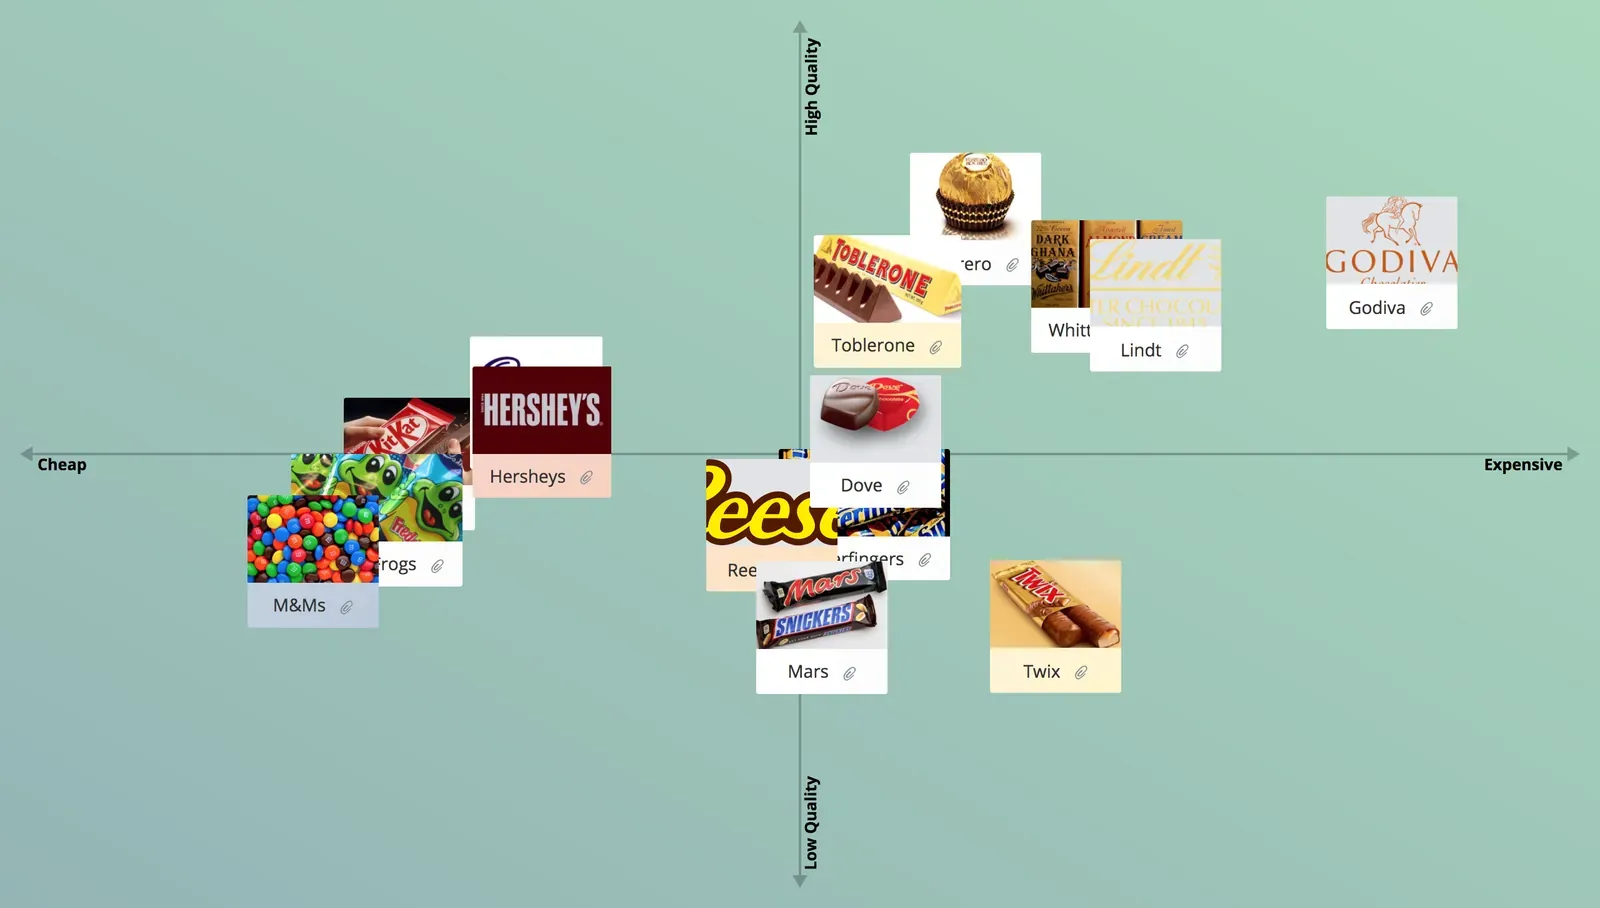
How to create a Perceptual Map
Assemble a group of consumers or across a range of relevant demographics. The quality of the outcomes is dependent on the insight of the participants, and a diverse group helps to gain a better insight into the market.
Gathering a large group in one location can be expensive and difficult to coordinate. Using an online collaborative tool such as Groupmap enables facilitators to engage consumers in different places at different times and effortlessly combine the results to get an overview.
There are 3 general steps in perceptual mapping. The time required to complete the map will vary on the size of the group, and the focus of the session. However, there is no reason why the map can’t be completed in less than 20 minutes. Development of a comprehensive plan in response to the map will require further effort.
Create a Perceptual Map in GroupMap
Save effort, time and money with GroupMap
GroupMap offers more than just an online digital whiteboard—it’s innovative platform is designed to enhance the quality of your team’s decisions. With features that prevent bias and make facilitation seamless, GroupMap ensures no single voice dominates and ensures productive, inclusive conversations. Its intuitive interface is easy for anyone to use, and its scalable design supports small teams and large groups whether they are face to face or around the globe. Customizable templates and workflows keep discussions focused on objectives, helping you drive actionable outcomes each and every time.
Frequently asked questions
What is a perceptual map?
What are common perceptual map axes?
Why is a perceptual map useful?
Who should you involve in a perceptual map?
How long does it take to build a perceptual map?
What is a good facilitation tip for perceptual mapping?
How to run it in GroupMap

Set dimensions
Define the attribute dimensions on the perceptual map template.

Brainstorm
Gather products from a group of consumers.

Position
Position products on the perceptual map template.

Share
Report on the outcomes and monitor as part of your strategy.
Ready to get everyone on the same page?
Start a free GroupMap and turn your next discussion into clear, shared decisions.