Graphic organizers
Graphic organizers are visual tools that arrange information to show how ideas connect. Explore the main types and build one live with your class or team.
What are graphic organizers?
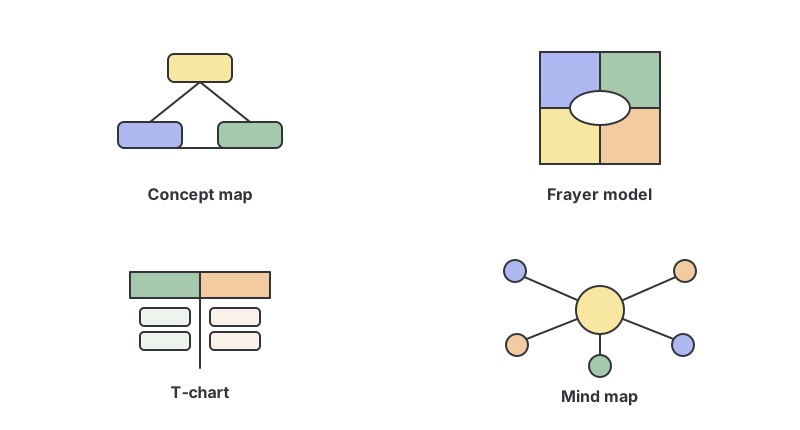
Graphic organizers are visual tools that arrange information and ideas to show how they relate to one another. Instead of a wall of text, a graphic organizer uses boxes, columns, links and layouts to make structure visible: which relationships exist, how two things compare, or how a term is defined. Concept maps, Frayer models, T-charts, mind maps and KWL charts are all graphic organizers, each shaped for a different kind of thinking.
They are a mainstay of teaching because they externalize thinking: laying ideas out spatially lightens the mental load, exposes gaps, and helps information stick. And they are just as useful for any team untangling a complex topic, weighing a decision, or building a shared understanding.
The catch is that graphic organizers are usually filled in alone, on paper. GroupMap changes that: you build the organizer together, live, with a whole class or team contributing at once (adding ideas, arranging them, and voting), so the finished chart reflects everyone’s thinking, not just the person holding the pen.
Graphic organizers for relationships and understanding
When the goal is to show how ideas connect or to understand a concept deeply, reach for a mapping or vocabulary organizer.
- Frayer model: a four-square organizer (definition, characteristics, examples, non-examples) that builds a deep, well-rounded understanding of a single term.
- Group mind mapping: radial brainstorming around a central topic when you want to generate ideas fast.
Graphic organizers for comparing and inquiry
When the goal is to weigh two sides or drive an inquiry, reach for a comparison or sequencing organizer.
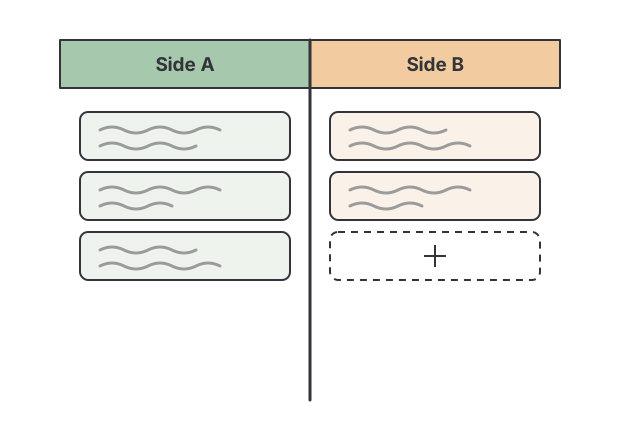
- T-chart: a two-column organizer for any two-sided comparison, such as pros and cons, before and after, cause and effect, facts and opinions.
- KWL chart: capture what a group already Knows, Wants to know, and has Learned about a topic. There is a free printable KWL chart in PDF if you need a paper handout.
- KWHLAQ chart: an extended inquiry organizer that adds how we find out, action, and further questions for deeper, research-led learning.
Build them together, live
A graphic organizer is far more powerful when a whole group builds it at once. In GroupMap you can:
- Contribute in real time: every student or team member adds ideas simultaneously, so no one waits their turn and quieter voices are heard.
- Arrange and group: cluster related contributions and shape the organizer together.
- Vote and prioritize: surface the strongest points or the ideas that matter most.
- Share instantly: export the finished organizer as a study aid or a shared reference.
The result is an organizer that captures the room, not just the person at the board.
Whether you are teaching a class, running a workshop, or thinking through a problem with your team, a graphic organizer gives the discussion structure, and building it live in GroupMap gives everyone a voice in it.
Ready to get everyone on the same page?
Start a free GroupMap and turn your next discussion into clear, shared decisions.