Webinar Digital Facilitation Techniques: Keeping Our Most Precious Resources Safe & Secure.

water-cyber-security

Leadership in water management via digital facilitation  

As a member of the Water Harmony Global Initiative (WHGI) and research group on Water, Environment, Sanitation and Health (WESH), Dr Zakhar Maletskyi runs global webinars and digital facilitation.

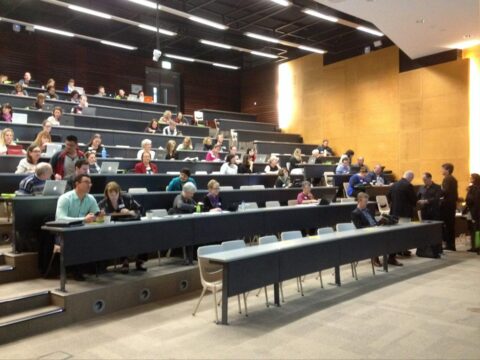
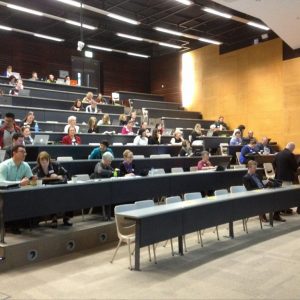
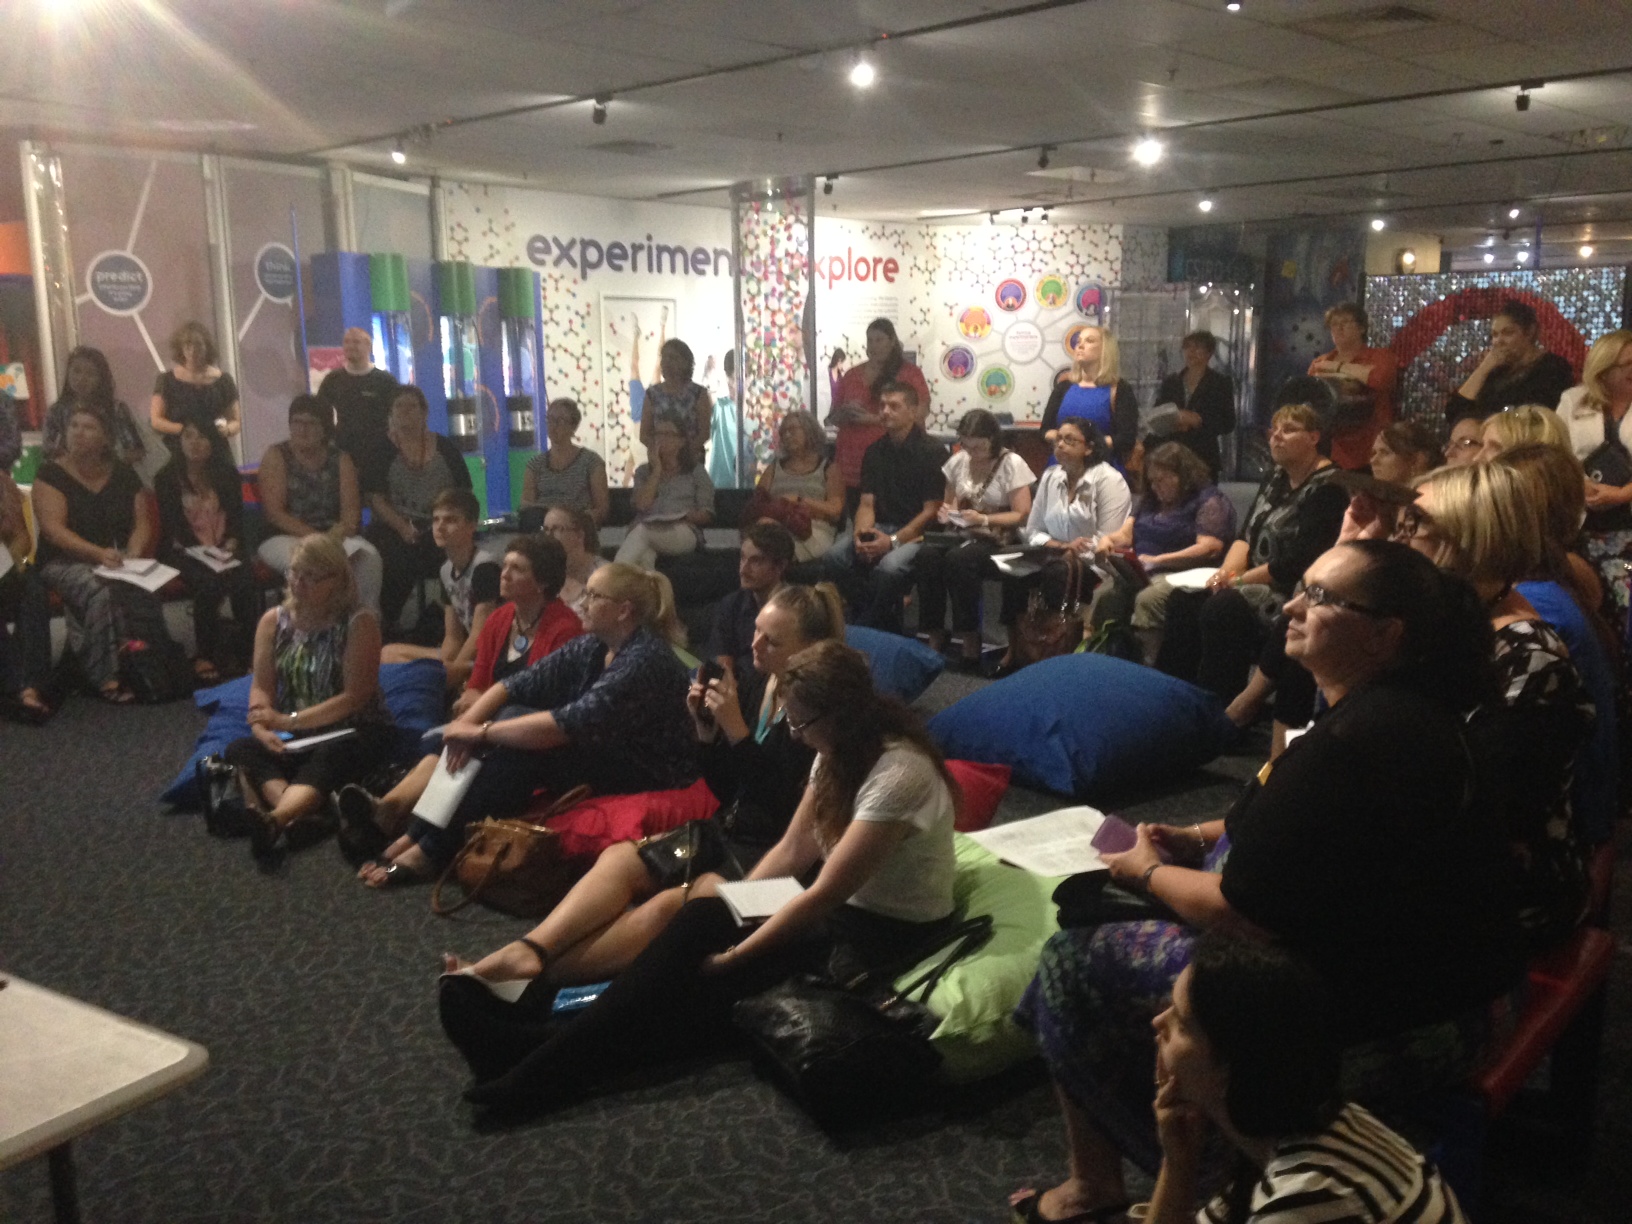
He takes on a facilitator role for both organisations and its related groups, managing workshops and webinars. These events are attended by global researchers, government officials, security experts, not for profit specialists. Together they brainstorm and develop solutions for challenges our world face when it comes to securing and protecting our most valuable natural resources. 

Some key facilitation highlights for Dr Maletskyi include:

  • The Water Harmony Global Initiative (WHGI)’s webinar to further the teaching of water related education globally, with participants attending from Africa, Asia, the EU and North America.
  • Interactive webinar to discuss the opportunities and threats that digital technologies bring to our water source.
  • Water, Society and Climate Change interactive workshop on “Solutions to water & climate change nexus.”
  •  SWARM+ Erasmus project workshop on Strengthening of master curricula in water resources management for the Western Balkans HEIs and stakeholders.
Dr Maletskyi presenting at the 2022 IWA Congress

“As a facilitator, my responsibilities are to drive group work through brainstorming and establish the most prudent solutions to water resource management issues that countries are facing globally.”

Challenges of running webinars & digital facilitation 

Webinar digital facilitation brings many benefits – the obvious ones being a wider, more global audience, time and cost savings from travels, physical venue bookings and materials. 

One of the main challenge of webinar digital facilitation for Dr Maletskyi is interaction, which covers a wide range of further challenges, including:

  • Lack of visual cues and feedback 
  • Lack of engagement 
  • How to build connection between participants
  • How to connect well as the facilitator

With so many digital facilitation options available as well, wading through to find one that presents solutions to all of the above can also be a challenge in itself. The goal was to find a simple visual tool that was process driven that could help engage interaction and collaboration centered around the key themes.

GroupMap creates successful webinar digital facilitation  

Dr Maletskyi came across GroupMap and has been using it to digitally facilitate important workshops and webinars around the world. 

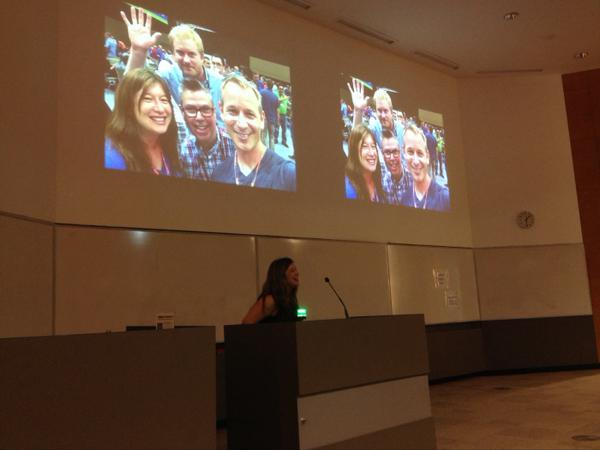
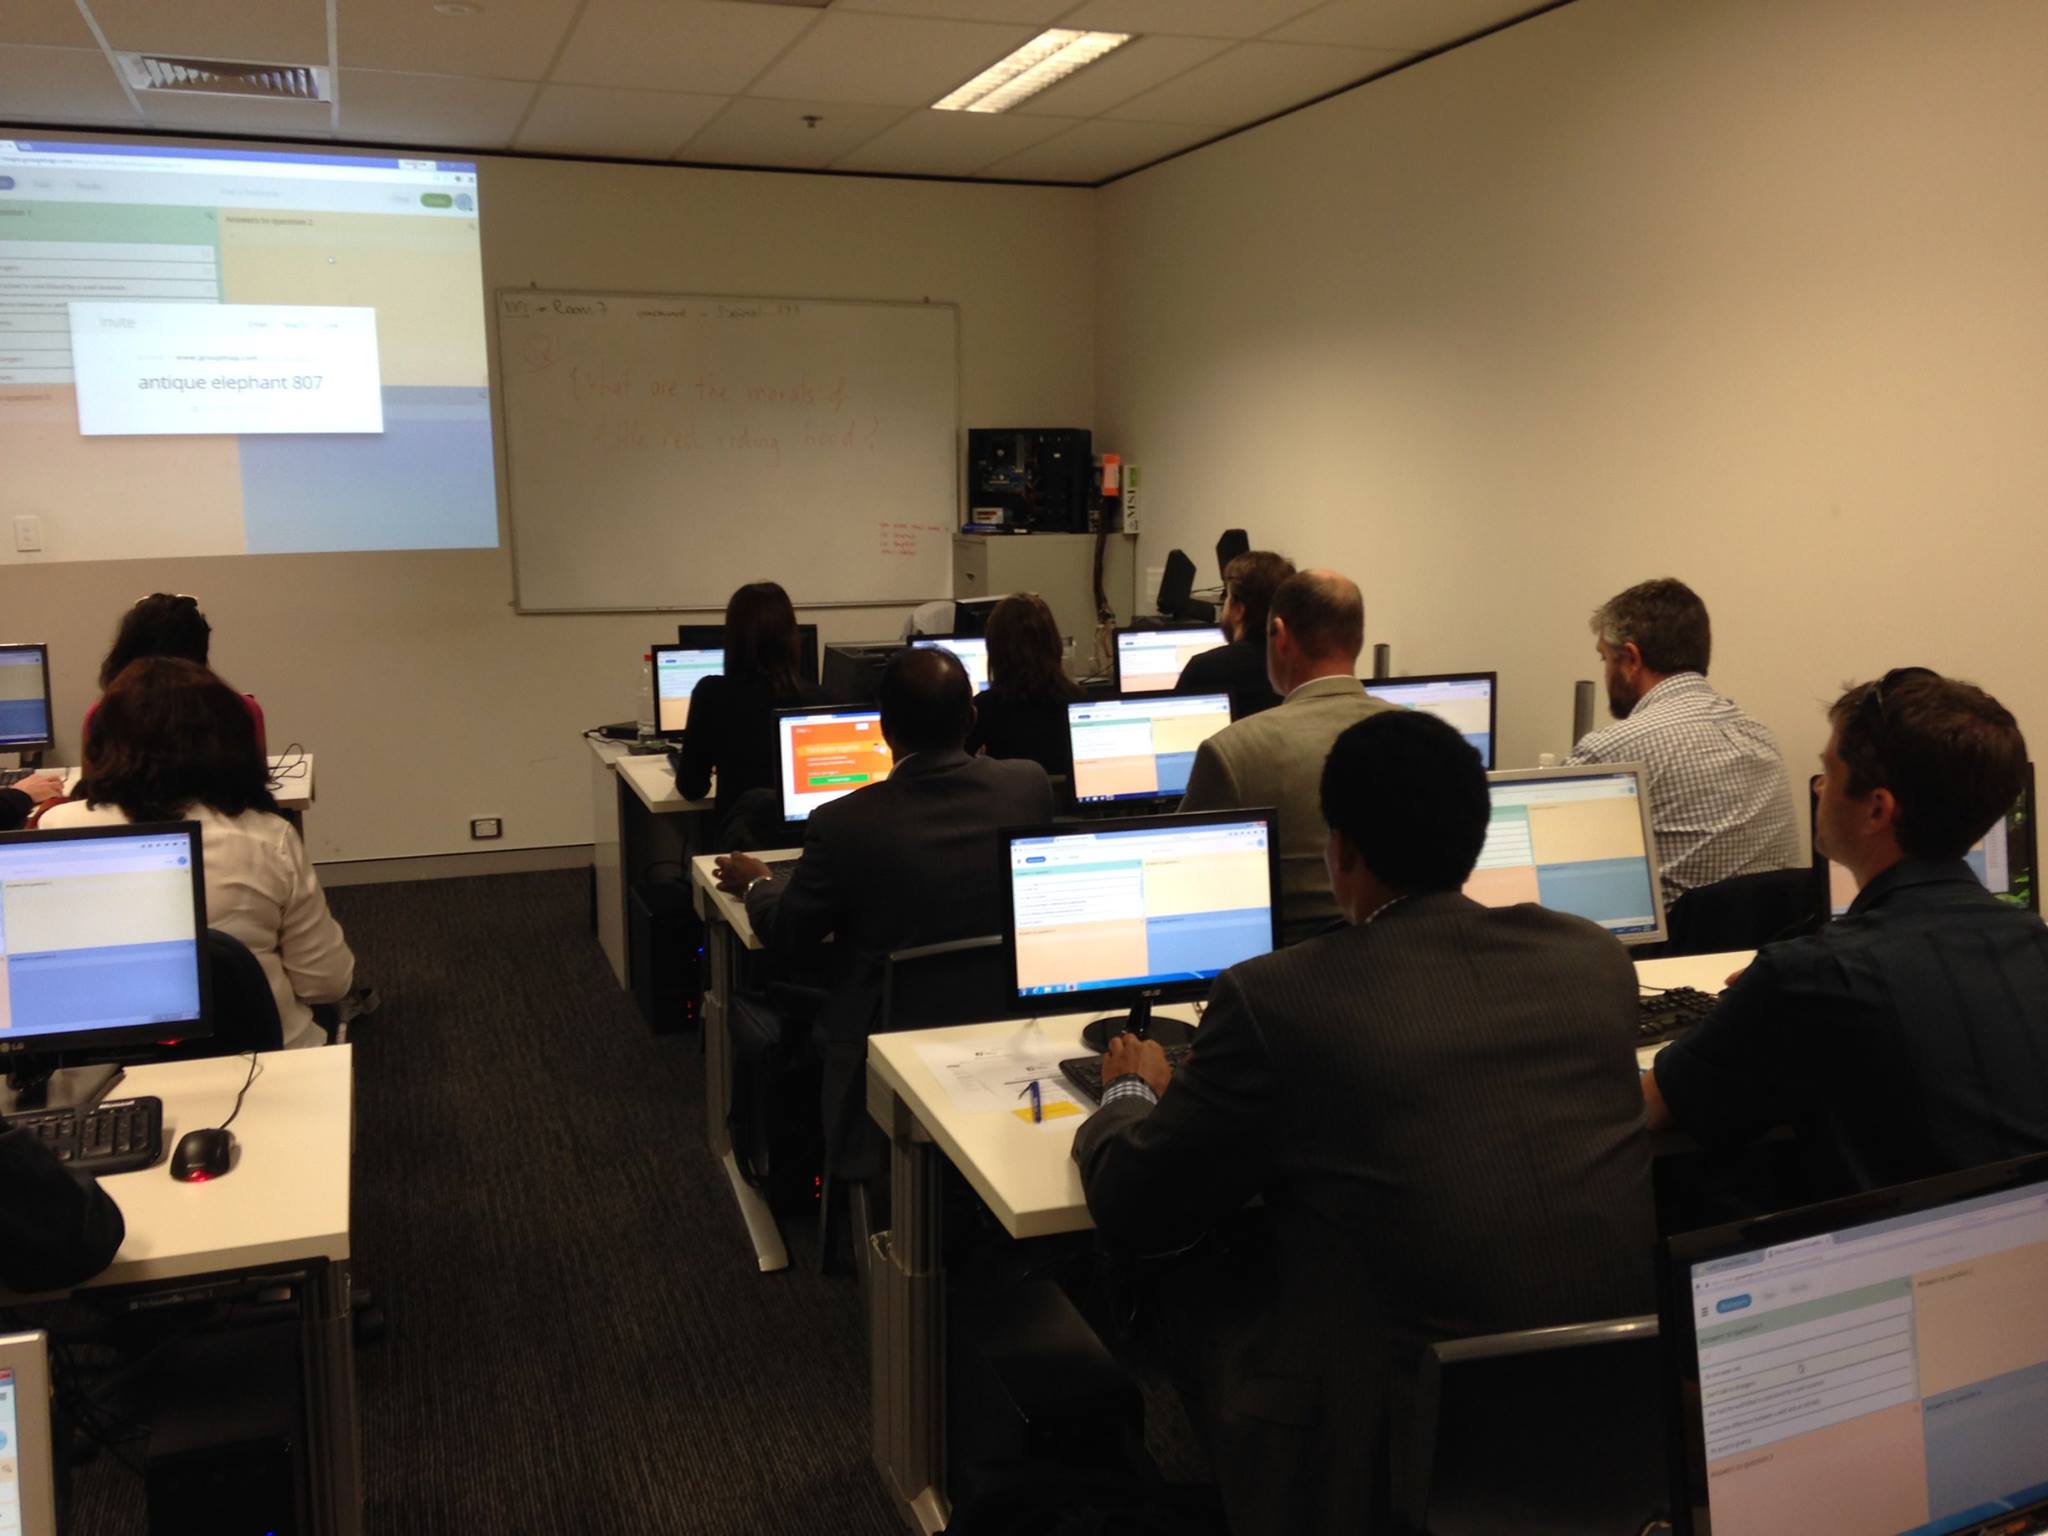
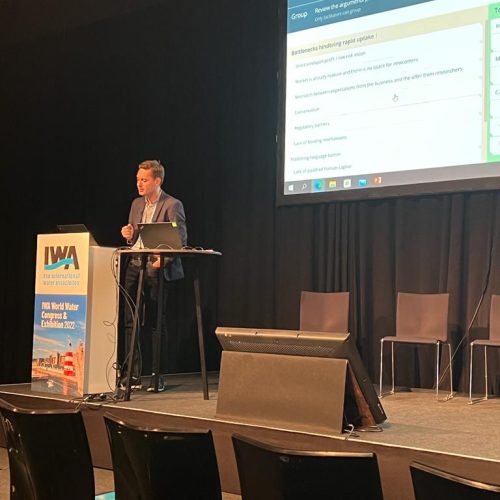
Dr Maletskyi has used GroupMap with smaller groups of close colleagues, and also for webinars, one of which reached 251 participants.  The event targeted Managing risks form digitalisation in the water sector and was a 90 minute webinar session that involved presentations, interactive audience activities and a Q&A session with Panelists:

He explains that before starting up any GroupMap session, he would send participants a basic agenda as part of his PowerPoint presentations. 

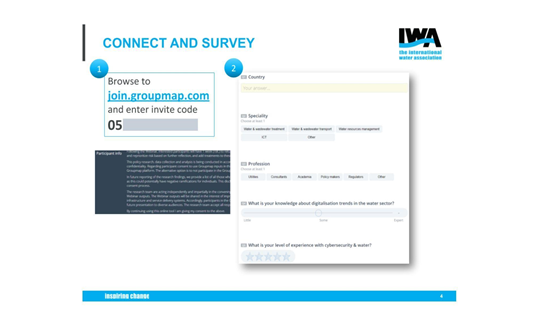
In the agenda, Dr Maletskyi includes a brief tutorial on how to use GroupMap  – how to interact with the templates, and how to share ideas. He also used the Survey tool in GroupMap to get a sense of who was participating in the webinars.

online-meeting-risk-analsis-template-image
Risk Management in GroupMap

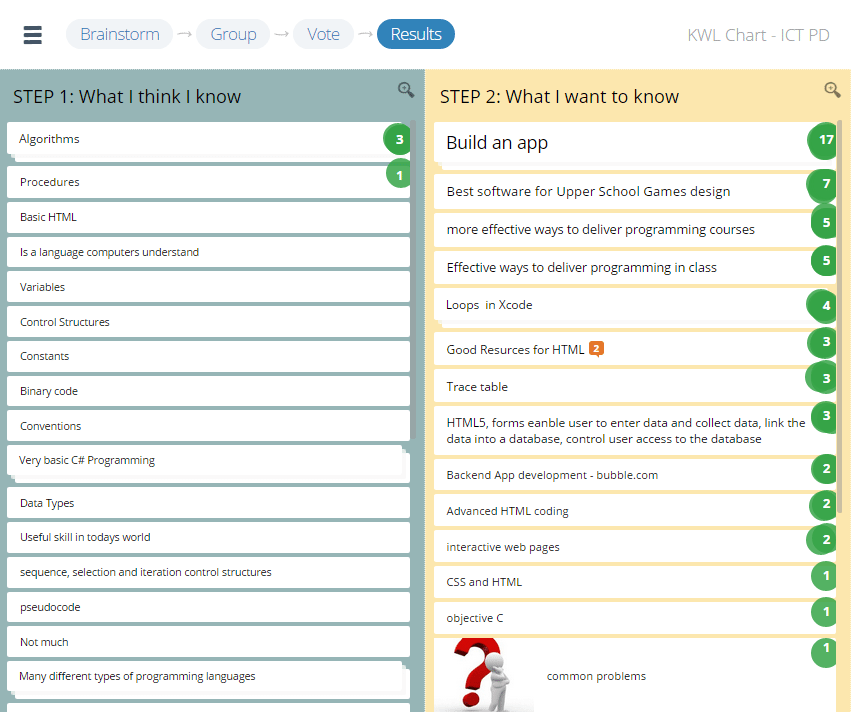
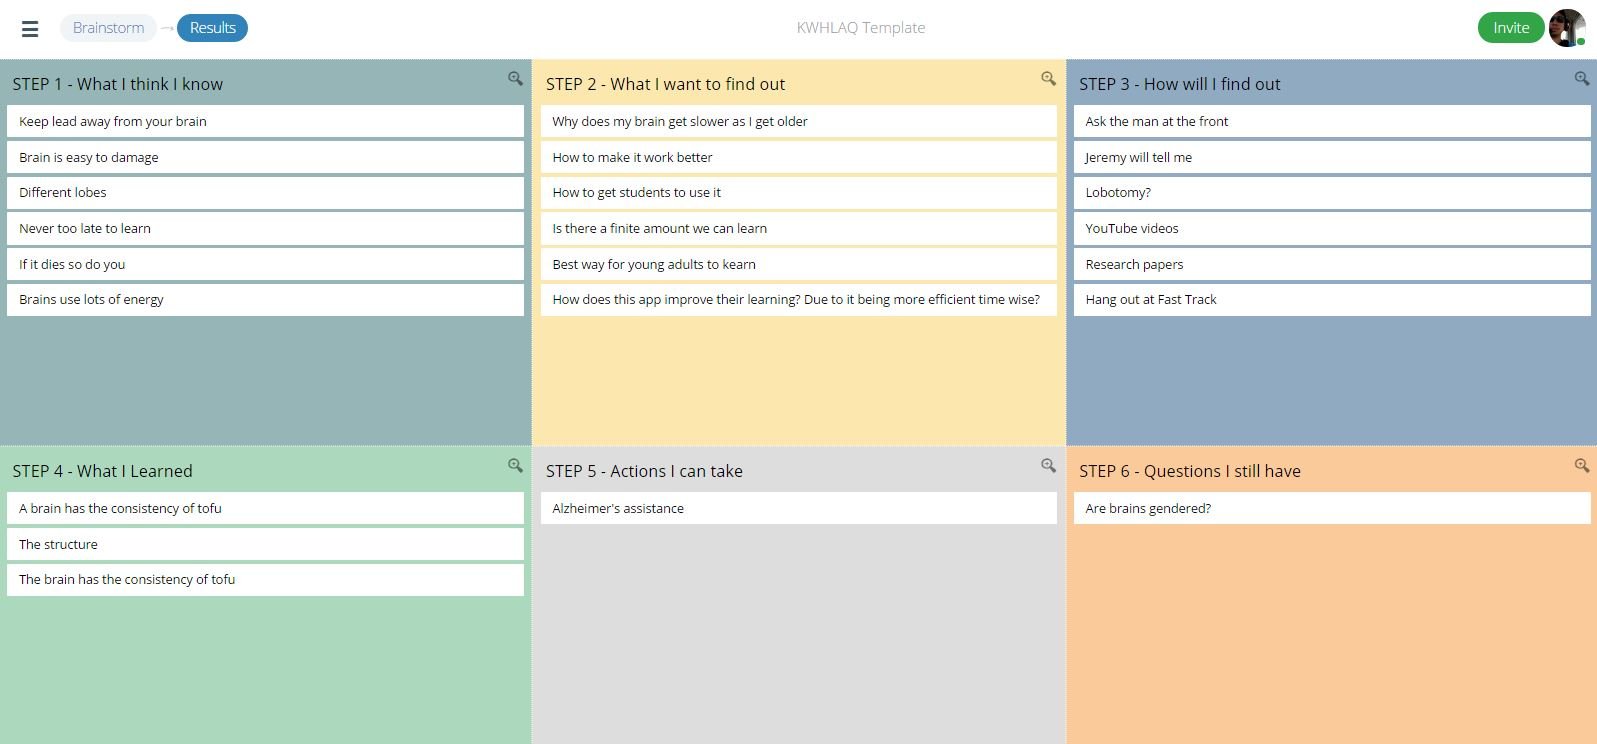
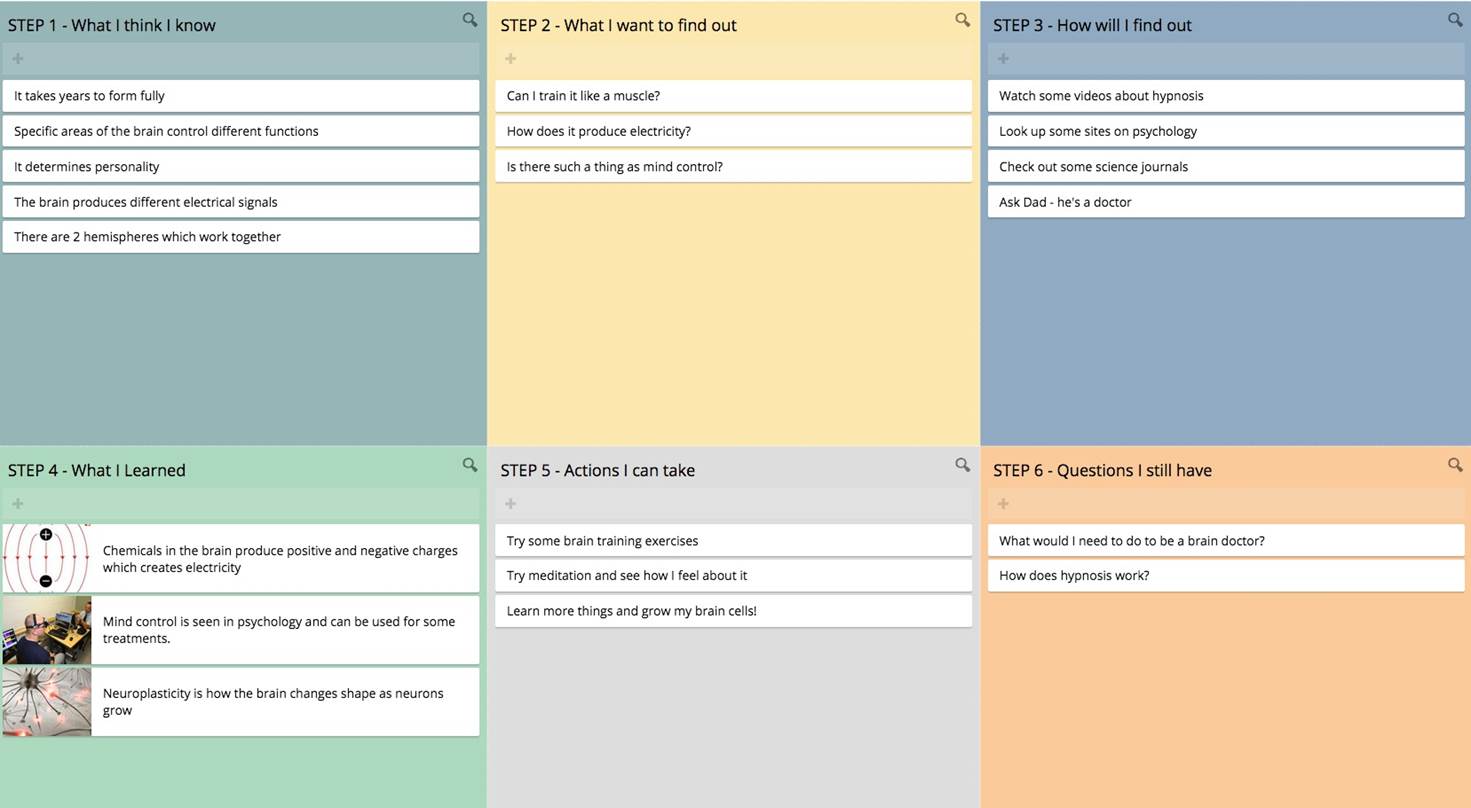
“I found GroupMap effective for my needs because not only was it a familiar tool but unlike other tools it allowed for a step by step process,” commented Dr Maletskyi.  

webinar-polling-image
Webinar Polling
“Other tools don’t provide the same level of interaction as GroupMap. It has a clear and concise process, from brainstorming to rating of opinions and ideas and finally the results. This is extremely useful with my groups.”

“This type of interaction hasn’t been replicated by any of the other tools that I have used.”

digital-facilitation-webinar-techiques-risk-analysis-image
Digital Facilitation Risk Assessment

Global water management in safe hands 

Dr Maletskyi shared how GroupMap allowed successful interaction with 251 global participants on managing cyber security threat on the water sector:

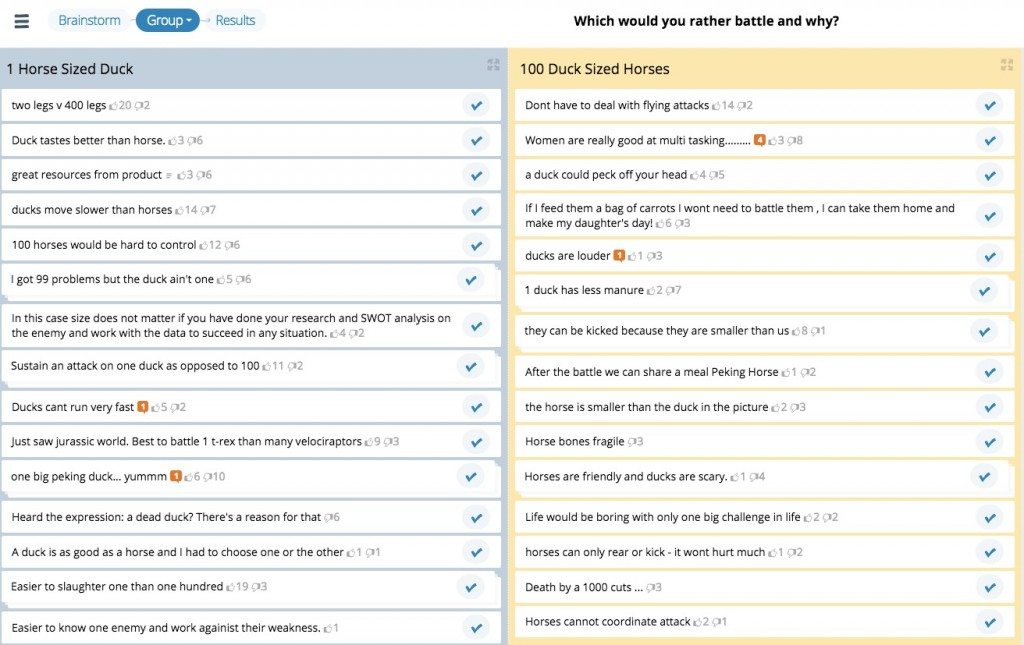
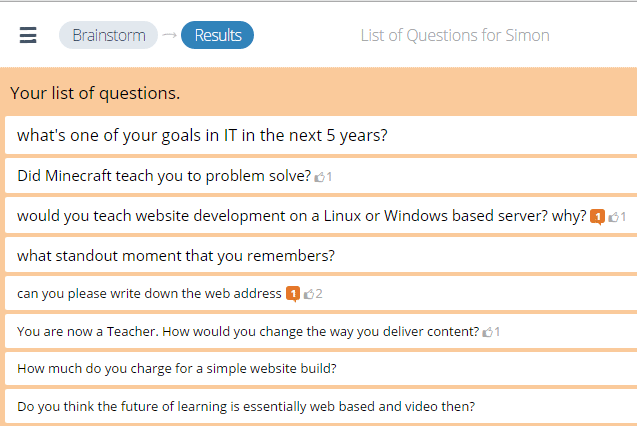
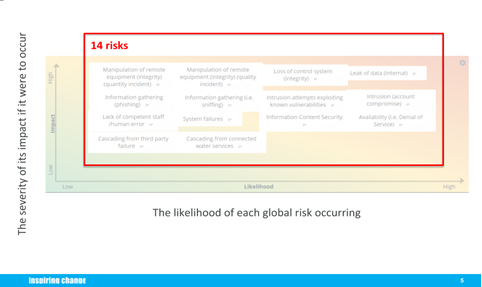
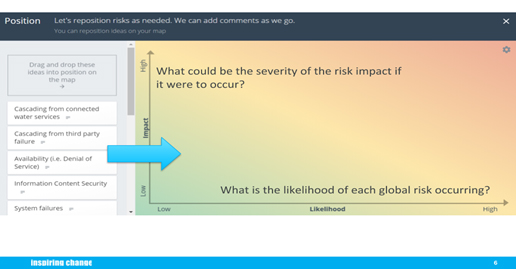
“It was easy to run the webinar thanks to the simple but effective features of the risk assessment template. The people voted on certain portions of the map for five risks. These were risks that would require management. All the votes organized the risk severity from most to least.”

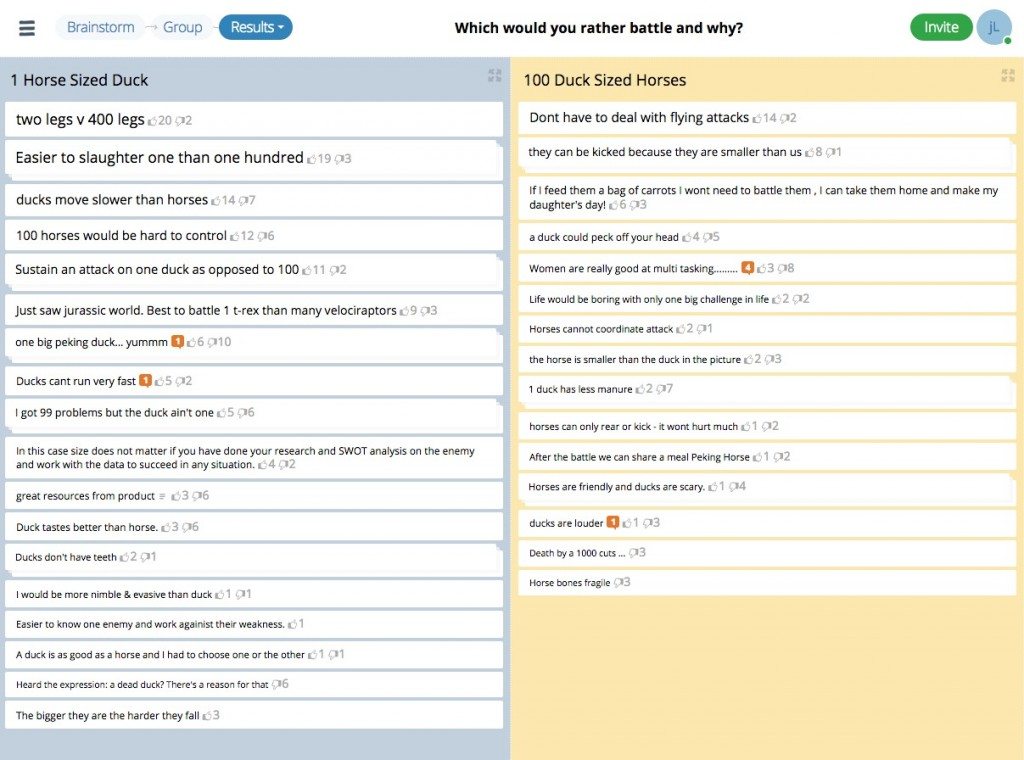
“GroupMap can neatly organize the large volume of people brainstorming at once, allowing large amounts of information that doesn’t overwhelm the users and facilitators’ screens.” 

Dr Maletskyi commented that large webinar events that require interaction for its success would not have been possible without GroupMap. 

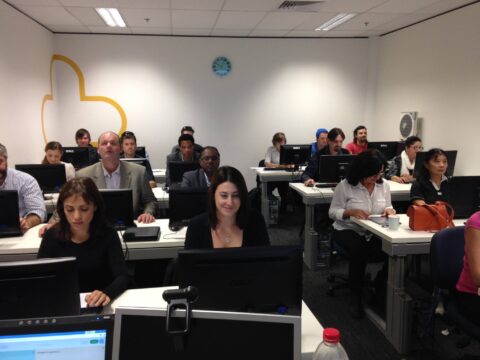
“I use GroupMap with many of the people I work with currently. I’ve had success with GroupMap for webinars and my university work. Now I encourage people who attend my lectures and webinars to use the tool.” 

The ability to gather global information and data in an organized and meaningful way results in time and money savings. It also means quality data could be shared, accessed and analysed more effectively. Action items could then also be added in real time to the top risks and reports generated for the webinar.

Want to try GroupMap for your next online meeting? 

Schedule a demo with a GroupMap team member at a day and time that suits you best or have a go of our easy to use, supported online collaboration tool for FREE for 14 days today. 

A Critical Thinking Exercise – Which would you rather battle?

See how this simple exercise had over 100 people brainstorming and voting on the best arguments. Industry professionals meet VET teachers to bring currency to the curriculum.

Ask yourself this.  Which would you rather battle?

1 horse-sized duck or 100 duck-sized horses?

[mk_image src=”https://www.groupmap.com/wp-content/uploads/2015/09/499796_1379897619845_500_500.jpg” align=”center” crop=”false”][vc_column_text]

This was the question posed to attendees of the Industry Currency day where over 110 VET teachers were asked to share and debate their views using GroupMap as their audience response system. This professional development session was focused on ways to improve critical thinking skills – a key learning outcome for 21st-century learning in any curriculum.
[/vc_column_text][mk_image src=”https://www.groupmap.com/wp-content/uploads/2015/09/perth-industry-forum-groupmap.jpg” align=”center” crop=”true”][vc_column_text]

Each person was asked to pick a side initially. Working in small groups, they then added arguments to be shared more widely as part of the collaborative learning exercise. Here are some of the ideas they came up with.
[/vc_column_text][mk_image src=”https://www.groupmap.com/wp-content/uploads/2015/09/screenshot-maps.groupmap.com-2015-09-02-18-18-17.jpg” lightbox=”true” target=”_blank” desc=”Grouped Ideas on critical thinking exercise” align=”center” crop=”false”][vc_row padding=”0″][vc_column][vc_column_text]

With the opposing views  captured, this became the perfect fodder for a healthy debate. But we wanted to take it one step further to work out which arguments were the strongest.


Use of voting techniques to identify logical fallacies


Using the concepts of logical fallacies (flaws in logic) and the simple like/dislike buttons, people voted up the arguments that they felt best made their case.  The best and strongest arguments would then float to the top and the results shown. The goal was to focus on the strongest arguments put forward by the each side.
[/vc_column_text][mk_image src=”https://www.groupmap.com/wp-content/uploads/2015/09/screenshot-maps.groupmap.com-2015-09-02-18-19-05.jpg” lightbox=”true” target=”_blank” desc=”Ideas sized and sorted by strength of argument” align=”center” crop=”false”][/vc_column][/vc_row][vc_row padding=”0″][vc_column][vc_column_text css=”.vc_custom_1528283012178{margin-bottom: 0px !important;}”]

Running through the ideas allowed people to comment and to support and challenge what was being said by their peers. This form of collective learning certainly isn’t something you could do with simple polling.

The group discussed the arguments presented and considered the impact this had on their position on the matter. Whilst a hypothetical discussion, it highlights the importance of forming a good argument free from logical flaws.

Hosted by Training Council (FAPSTC) and held at Curtin University, the Industry engagement forum provided a technology driver environment for the VET sector to interact with speakers and industry representatives. More than 40% of year 12 students undertaking a VET qualification in 2014.  The event was an outstanding success.


“Alison Sweet, event organizer from FAPSTAC said: “Teachers can gain insights to help them take industry intelligence and embed it into their classrooms, creating relevant, authentic and innovative environments.”[/vc_column_text][/vc_column][/vc_row][vc_row padding=”0″][vc_column][vc_column_text]

Part of the session also included an interactive industry Q&A powered by GroupMap. “We wanted to lead by example, “ said Sweet, “and make the most of collaboration tools like GroupMap. It allows audience members to ask questions to presenters as they have them, engaging those that might not be comfortable asking questions in a large group forum. The workshop organizers could see any unanswered questions posed by the group on GroupMap and could respond to them. Teachers could see group brainstorming technology in practice making it easier to implement strategies to engage students in the classroom.”

Additional sessions included test running a new social media platform called FauxBook, insights into careers in business, finance, and technology from Microsoft and BankWest, and industry updates from a panel of industry speakers.
[/vc_column_text][mk_image src=”https://www.groupmap.com/wp-content/uploads/2015/09/CLI4_7cVAAAKWHg-1.jpg” align=”center” crop=”true”][vc_column_text]

Ready to try your own critical thinking exercises?


Here are 5 tips to consider to help students become independent learners.

  1. Set examples that do not have a straightforward answer.


    These are your non-Google”able” items that challenge the student ability to examine perceptions, inferences and conclusions. “Which is better? Oranges or bananas?

  2. Start and end with “Why”.

    This is a clear sign that people are engaging in thinking.  A simple technique is to ask Why 5 times so you really drill down into the basic logic.
  3. Aren’t questions great?

    Learning stops at an answer and thinking starts with a question.  A Socratic style and deliberate questioning with the group will get those neurons firing.
  4. Engage in visual thinking.


    In this blog example, we used a 2 column list just to represent opposing views. Additional options such as Plus, Minus Interesting, 6 thinking hats, or a collaborative mind map provide different thinking activities. The use of space with graphic organizers helps to organize thoughts and to make it easier to see what the thinking is in the room.

  5. Give them time to think.


    Want to avoid that awkward silence when you ask a large group a question? Critical thinking exercises require a little introspection and processing time. Give people a chance to brainstorm individually first (yes, this is a feature in GroupMap).  They can then share more broadly and with confidence with the wider group.


If you would like to watch a quick critical thinking exercise in action, please watch the below video.

[/vc_column_text][vc_column_text]

[/vc_column_text][/vc_column][/vc_row]

Graphic Organizers Training at the AICT

PD teacher training GroupMap

Held at the AICT in the Central Business District, this Industry currency and vocational competency day were aimed at teachers delivering courses in Applied Information Technology, Business Management, and Computer Science. Kristen Reddin, Founder of Devise PD, aimed to engage participants in a range of new technologies aimed to improve classroom delivery.

The Australian Institute of Commerce and Technology had facilities similar to modern schools with teachers being able to see how a good setup can directly impact the learning experience. Sessions included live streams from the States included young entrepreneurs who had developed their own apps through to TedX talks about the shifting culture of technology.

In this session, ICT teachers were introduced to a range of graphic organizers which they could use to customize the delivery of their lesson plans to improve student engagement and the learning experience. Our goal was to arm them with the ability to create more engaging experiences in the classroom and to boost student’s critical and visual thinking.

PD teacher training GroupMap

What They Know… What They Want to Know

Using a KWL graphic organizer, we asked teachers what they already knew in terms of coding and to get a sense of their current ICT experience and knowledge. This was a quick 3-minute exercise followed by a quick review.  Next, we spent a bit more time thinking about what they wanted to know. This would then inform the next presenters and let them focus their session for the audience.

Here’s a snippet of what they said.

KWL template graphic organizer

This was a fast and effective way of getting a quick “glimpse” into the current skills set of the room. They then dot voted (dotmocracy) to quickly identify the top things they wanted to learn from the rest of the day. This information was then shared with the presenter for the next section of the workshop.

Question and Answer Graphic Organizer

After this session, the teachers then went on to learn more about app development. Here’s what they did.

“Later in the day, we used GroupMap in 2 of the following sessions and it worked really well. I set Simon who was presenting through Google Hangouts, with access to a map. As he presented, people wrote questions which he then read out and answered. It was 1000% superior to a basic webinar.” Kristen Reddin – Founder, Devise PD.

This process lets the people in one room engage with the presenter in another part of the world, all in real-time. Each person asked questions which were suggested to others. If someone else had the same question, they would be able to add it to their own list. The result was a prioritized list of questions, with the most common at the top.

audience engagement graphic organizer

This was a really simple graphic organizer that simply allowed people to create their own lists which then combined into a single list. The bonus, of course, was that with fast session times, more questions could be answered for more people could comment on answers provided.

Training ICT teachers on GroupMap graphic Organizers

Session Evaluation

This session was later evaluated by the organizer, which they were kind enough to share with us here. We were completely pleased that they found the session valuable.

PD Session Evaluation

Impact on learning.

Of course, the purpose of this training is to encourage more effective engagement in the classroom and to allow students to be fully involved in the process. Being able to customize the map to the lesson plan lets people sort and categorize ideas, as well as using the group’s own feedback to collectively rank and decide on the key points. It’s a great way to get them actively learning in the classroom. See this blog post here about how graphic organizers were used to explore careers with 200 students.

The next Teacher PD session on graphic organizers in a workshop entitled “Improving Critical Thinking and Decision Making” will be held at Curtin University for the Financial, Administrative and Professional Services Training Council. Tickets have already been fully sold out but if you are interested in further training – please contact us here.  Additional free lesson plans with a range of graphic organizers can be downloaded here.

Graphic Organizers at the TeachMeet SciTech Event

GroupMap classroom teachers
Thanks to all science teachers who joined us at the GroupMap session

It was a fantastic turnout as teachers gathered for a lightning 6-minute GroupMap session. This activity involved a frenzy of phalanges as we explored the use of the KWHLAQ model for improving scientific inquiry.  Think of it like the traditional KWL (know-What- Learn) template but with a few additional steps to extend student learning. Graphic organizers like KWHLAQ provide a simple and effective way to complement your lesson plan through a process of reflection, collective sharing, questioning and applying.

We asked a few volunteers on the day to help us out with the activity here using a BuzzFeed video with a few snippets about the human brain. You can see some of the things they added from their iPhone, iPad or table on the day.  It’s a quick snap shot of how an edutech-enabled KWHLAQ runs.  Of course, this was a quick 5-minute exercise – it’s up to you how deep you want to take each activity.

In practice, this is an activity that you run across the length of your lesson plan, whether or not you have a flipped classroom. Here’s an example of a lesson plan.
[mk_padding_divider size=”40″]

visual organizer, KWHLAQ, GroupMap,
Example 1 – from the teacher participants at SciTech

How does the KWHLAQ impact student learning?

It may just seem like a series of questions, but each one leads them through Blooms taxonomy from recall through to synthesis and application.  The starting point is to pick your topic.  This tool is subject agnostic so it can be as simple as “What is the Sun?” through to “What are the key elements of forensic chemistry investigations.”
Here is the run down on each stage so you can decide how it might apply to what you teach:[mk_padding_divider size=”40″]

K – Let’s start with what you know.

This gets students to recall what they already know about the subject and activates conversations – who knows.. you may learn something new yourself! This is a good way for you to offer feedback or to challenge some of their initial assumptions, encouraging them to back it up with facts.
By quickly capturing the wisdom of the group, you get a sense of the starting point for the group.  I recommend doing this as an individual exercise to begin with. Individual silent brainstorming at this stage gives each person the opportunity to draw our more specific information and a way for each student to start thinking about the topic. It gets them all involved straight away and is often a way to see who has “contributed” the most in the first stage.
Once you think there is enough input, open it up to class discussion and feedback.  At this point, I like to provide a bit of content, a video or a few slides on the topic to add to or validate what the students have put forward.
[mk_padding_divider size=”40″]

W  – What would you like to find out?

This steps promotes inquisitive thinking, giving students the opportunity to design and create their own learning experience. Encourage them to question what might not be known and to consider why they are asking the question. Creativity is key here. You might add a few key things that you have to cover from the curriculum but then provide a little space for new discoveries. Sharing what people have put forward is a good way to inspire new perspectives.
If you are really short on time, you can ask students to vote on the things they want to find out about the most.  This will help focus the class on the key questions.
This list can help you design your next class or act as a blue print for the next step.
[mk_padding_divider size=”40″]

H – How would you find out?

This step encourages students to take charge of their learning. They have to think of the sources of information to answer those questions. Not everything should just be Googled. They may have to talk to others, design their own experiments, look at referenced articles or interview an expert.  If they are heading towards a design of an experiment, you may wish to separate this out to a separate activity around experimental design. I tend to give the most feedback here because I find that this is where they need the most guidance or lack specificity. Throwing in a few examples you expect from them doesn’t hurt.
Once this is done, they can start their research or activities. This is usually where there majority of time is spent.
[mk_padding_divider size=”40″]

L – What did you learn?

Once the class or activity is over, this reflective exercise asks students to summarise key learning from their work to be shared with the class. This is key to see if there have been any new facts gathered in the process. I love being able to give a thumbs up for new information that I find remarkable or worth recognising the effort put in.  This can sometimes be a step done after student presentations so that it can brings in learning from the whole class.
[mk_padding_divider size=”40″]

A – What actions can you take?

Great job so far. Now it’s time to make it real by asking students to think of a few ways the new found knowledge can be applied on a day to day perspective or to solve a different problem. By translating knowledge into action, this helps them consolidate information into a real application. It’s up to you how much emphasis you want to put to this.  Sometimes the thinking is enough, and other times, you actually want to go further to make it real, adding in comments and pictures.
[mk_padding_divider size=”40″]

Q – What new questions do you have?

Often the more we find out, the more questions we have, so this last step captures any new questions that may have come from the first round of activities. It teaches the importance of continued questioning and how our questions advance as we discover more.  It might even be the catalyst for the start of a new topic.[mk_padding_divider size=”40″]

visual organizer, KWHLAQ, GroupMap
Example 2 – Directed brainstorm with a single facilitator

Whilst you can do the activity above on paper, you can also use digital visual organizers to reduce manual collation and to give better real-time feedback. GroupMap, for example, let’s you switch between brainstorming styles, provide comments to students, vote in real-time and see what individual students as well as the whole class did.

The KWHLAQ template reminds us that we need to build on our existing pool of knowledge, be curious, scientific and deliberate, to share our findings with others in order to build on the knowledge pool and to apply it to solving real world problems. Aren’t these the basic principles of being a good science citizen after all?
Thanks again to the wonderful folks at TeachMeet and SciTech for inviting us along and to @EmCummuskey for this shout out. I hope the above is helpful in helping you deliver your next lesson.
twitter Teachmeet GroupMap
Have you applied the KWHLAQ activity in your classroom? What other tips can you give?
[mk_padding_divider size=”40″]

What is TeachMeet?

TeachMeet is a volunteer run organisation for Teachers by Teachers based on lightning quick presentations of teaching in practice. Our presentation was run at SciTech.
[mk_padding_divider size=”40″]

About the author

 Jeremy Lu has been a lecturer and tutor at Curtin University for the last 8 years, recognised as Sessional Lecturer of the Year 2014 at Curtin Business School. He is currently the School Business Manager for Science and has also helped start up teams with commercialisation of ideas. He has facilitated strategy and planning workshops with previous business management and training in the Health, Education and hospitality industry. He co-founded GroupMap as an online brainstorming tool to help improve the way people share ideas and a tool to help facilitators and educators improve the learning and decision quality of a group.


Want to try this out free? GroupMap offers a 14-day free trial so you can see if this is right for your classroom or school.