BCG Matrix
The BCG matrix (Boston matrix) sorts products into Stars, Cash Cows, Question Marks and Dogs. See a worked company example and build yours with our template.
What is BCG growth share matrix?
The BCG matrix (aka Boston Matrix) is a strategic planning tool which uses the relative market share and growth rate to assess the relative strength of products in a brand’s portfolio.
This is based on Market Share and Growth. The BCG model assigns products into four categories – Stars, Cash Cows, Question Marks, and Dogs – quickly identifying which products need attention and helps to inform their investment strategy.
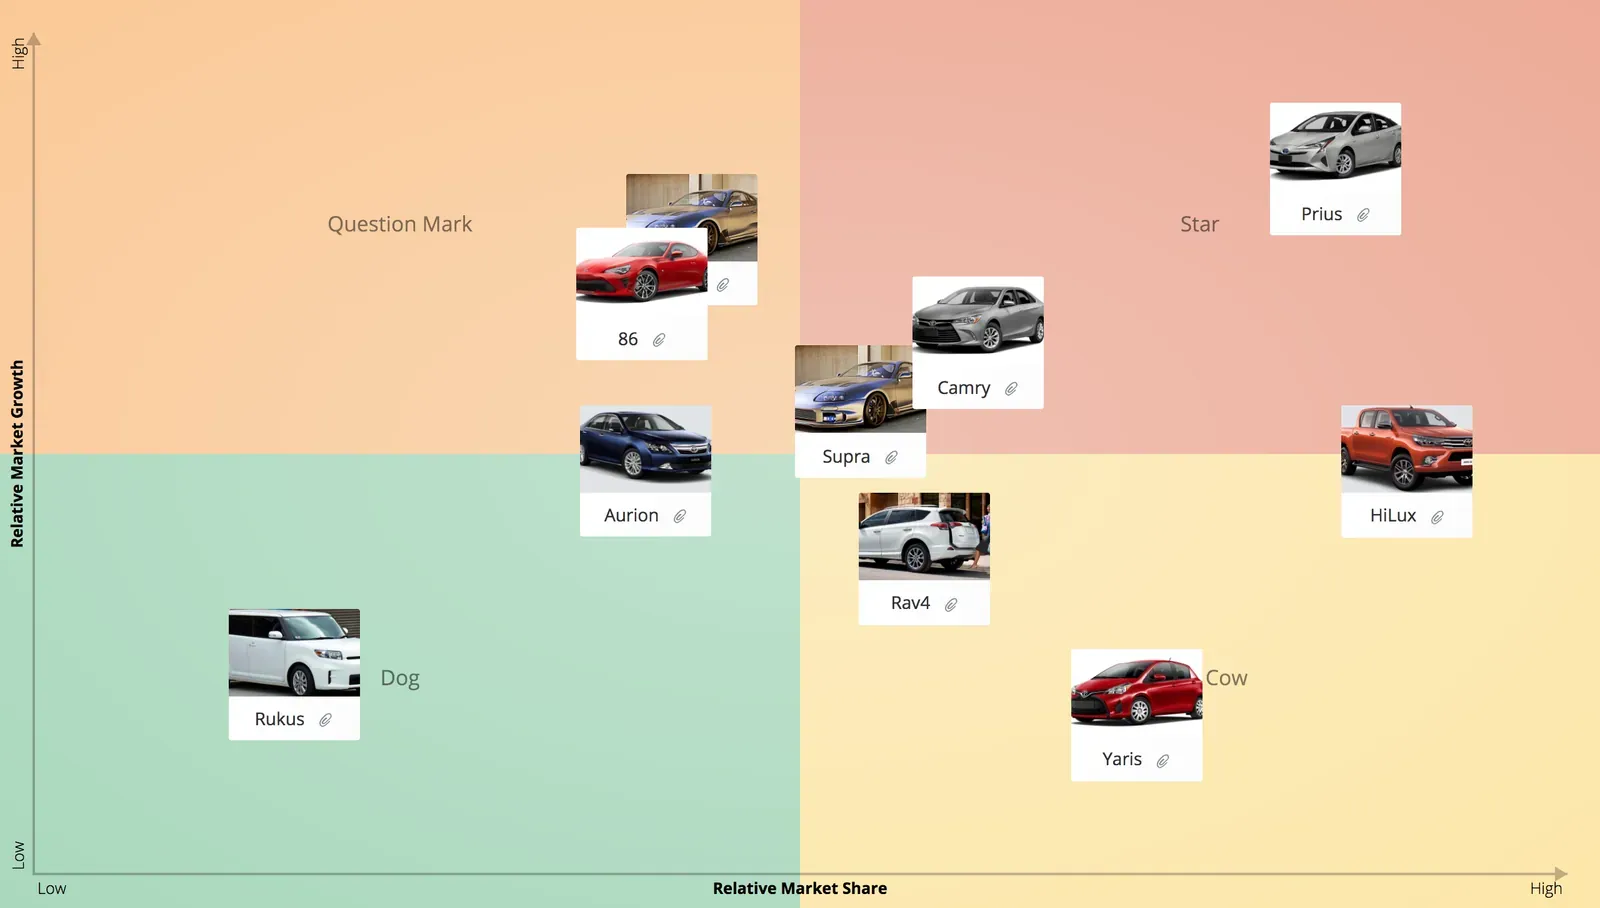
This growth vs share model provides an indication of which products an organization should invest in, those they should develop, and the ones they should get rid of.
The model advocates that a company milks their cows, doesn’t waste money on the dogs, invests in the stars and applies some resources to the question marks to identify if they can become stars.
Key takeaways
- The BCG matrix (or Boston matrix) plots the products in a company’s portfolio by market growth and relative market share.
- The four quadrants are stars, cash cows, question marks, and dogs.
- The strategy: invest in stars, milk cash cows, back the question marks that can win, and divest the dogs.
- See a BCG matrix of companies like Apple in the worked example below, then build your own live with your team in GroupMap.
BCG vs growth share matrix - is there a difference?
Essentially there is no difference. The growth share matrix was the brain child of Boston Consulting Group’s founder Bruce Henderson in 1968 and published in a provocative essay called Perspectives. It was used by about half of all Fortune 500 companies.
Over time it was also given the names of BCG growth-share matrix, Boston matrix, product portfolio matrix, Boston box, Boston Consulting Group analysis, or a portfolio diagram.
Tips for facilitating an effective BCG analysis
- Carefully select participants to provide expert knowledge but also a fresh perspective.
- Use technology to involve critical people in different locations rather than miss their contribution.
- Minimize Groupthink by brainstorming ideas individually then combining issues to get the overall picture.
- Be specific rather than broad when defining ideas.
- Use quantitative data where possible to focus on the crux of the issue.
- Provide adequate time in the session to rank and prioritize ideas.
- Communicate outcomes to stakeholders and regularly update progress on actions.
Why use BCG Matrix?
The BCG matrix is a simple, easy to use tool that:
- Identifies products that are profitable now, those with potential, and those which are, or could be, a drain on resources
- Informs resource allocation across a product portfolio
- Helps a company establish strategies to be a market leader through a sustainable portfolio of products and services that captures and serves a particular range of consumer markets.
- Provides a visual representation of a company’s product portfolio across the aspects of potential growth and relative market share.
Limitations of the BCG Matrix
The BCG Matrix provides a resource allocating framework between different business units but there are certain limitations. These include:
- The market needs to be clearly defined for this to be effective.
- Having a high market share does not necessarily equate to profits. The overall goal of the business needs to be considered. High market share also may require a high level of investment.
- At times, dogs may be playing a support role such as a loss leader and help other parts of the business gain or maintain a competitive advantage, sometimes earning more than cash cows. The model suggests simply removing this part of the quadrant but should be considered at a high level across its overall fit in the business.
BCG Matrix example
The BCG matrix template plots products or product categories against two variables:
-
Relative Market Share (horizontal axis) – the higher the market share, the more cash likely being generated. This measurement reflects a brand’s competitive position and is usually expressed as their market share relative to their closest competitor.
-
Market Growth Rate (vertical axis) – products with high market growth rate usually have higher earnings but also consume lots of cash and require investment to pursue and maintain that growth. Market growth is a good indicator of industry attractiveness and gives an indication of a product’s future potential, overall market strength, and attractiveness to future competitors.
| Quadrant | Market growth | Market share | Suggested strategy |
|---|---|---|---|
| Stars | High | High | Invest to maintain the lead and growth |
| Cash cows | Low | High | Milk for cash; invest as little as possible |
| Question marks | High | Low | Back the ones that can become stars; divest the rest |
| Dogs | Low | Low | Divest or retire, unless they support other products |
Question marks
High Growth, Low Share
Products with low market share but in high growth industries. Often associated with emerging markets. These products:
- have the potential to gain market share and become stars
- may eventually become cash cows when market growth slows
- can become dogs if they don’t succeed in becoming a market leader after a period of investment or the market growth declines.
Suggested actions: Carefully analyze to see if they’re worth investing in to increase market share. Consider investing for market penetration, market development, or product development; or divesting.
Dogs (or pets)
Low Growth, Low Share
Products with low market share in a mature, slow-growing market. These products:
- usually generate minimal profit
- are sometimes maintained for strategic purposes e.g., they provide jobs, have synergies with other business units, or are a defense against competitors.
Suggested action: Consider eliminating these products by retrenching, divesting, or liquidating. Maintain (in special circumstances) where it is supporting other products to maintain a competitive advantage or is cash positive.
Stars
High Growth, High Share
These products have a high market share and are in a fast-growing industry. They bring in good profits and have an opportunity to expand further in a growing market. Stars help to assure the future of a company. These products:
- are question marks that have gained market share and are improving.
- can become cash cows as the market stabilizes.
- may become dogs if they lose their competitive edge, and the market becomes obsolete (not uncommon in technology fields).
Suggested action: Resource to maintain market position and growth. Consider vertical or horizontal integration options, investing for market penetration, market development, or product development.
Cash cows
Low Growth, High Share
Products with high market share but low growth. These products:
- generate good profits and supply funds for future growth
- were often stars in the market which has now matured and slowed
- don’t have many opportunities to expand as the market is growing too slowly for investment to be worthwhile.
- might become stars with further product development.
Suggested action: Support to maintain their current market share. “Milk” while investing as little as possible. Consider investing in product development, diversifying, divesting or retrenching. This requires optimal allocation to maintain its status.
BCG matrix example: companies like Apple
A BCG matrix of companies is one of the clearest ways to see the model in action, and Apple is the example most often used. Positions are always relative to market growth and share and shift over time, but a simplified snapshot might look like this:
- Stars – the iPhone, holding a leading share in a still-growing premium smartphone market.
- Cash cows – the Mac and iPad, mature lines that generate reliable profit with limited new investment.
- Question marks – newer bets such as Vision Pro, in fast-growing categories where Apple is not yet the clear leader.
- Dogs – discontinued lines such as the iPod, overtaken as demand moved to smartphones.
The value of the exercise is not labeling products for its own sake — it is deciding where to invest: fund the stars, milk the cash cows, back the question marks that can win, and retire the dogs.
How to use BCG analysis
The BCG matrix is based on the theory that in a natural business cycle, products usually start as question marks, then become stars as the market grows. When that growth slows they become cash cows and eventually dogs. A diversified company will have products across the spectrum to ensure future growth and funding.
Using the BCG matrix, you can either pre-populate items or ask people to add in items under each quadrant. They can add attachments, files, descriptions or other information to justify their current position. Leading a discussion allows everyone to look at the overall placement and see if there is a need to adjust their positioning.
Now comes the important aspect of having people brainstorm strategies and actions against each of those strategies. They can be added as comments, and then once confirmed, turned into action items.
Agree on actions for each entry, and assign responsibility and timeframes. At this early stage of analysis, actions may only be a broad commitment to investigate further or they might document a decisive strategy. Examples of actions might include:
- Increase Investment in product A to increase market share
- Maintain current strategy with Product B.
- Decrease Investment in Brand C to maintenance levels (cash flow)
- Sell, or stop production of, Product D.
Distribute the final report on the session with the associated action plan to the team members. Ensure all participants are clear on what needs to happen and by when. This report provides the roadmap for marketing, resourcing, and production strategies.
GroupMap allows you to capture ideas, group or individual positioning and to capture comments and action items against each portfolio item, without losing sight of the big picture.
Who should use BCG Matrix?
The BCG matrix is mainly used by internal management that has more than one product competing for resources. It can inform a number of different business functions including marketing, strategy, and portfolio planning.
Generally, this is only suited to companies who provide multiple products and/or services and looking to refine or consolidate their internal business strategies. Single line companies may be better served by the use of a competitor analysis perceptual map.
Related templates
References

Save effort, time and money with GroupMap
GroupMap offers more than just an online digital whiteboard. Its innovative platform is designed to enhance the quality of your team’s decisions. With features that prevent bias and keep facilitation simple, GroupMap makes sure no single voice dominates and keeps conversations productive and inclusive. Its intuitive interface is easy for anyone to use, and its scalable design supports small teams and large groups whether they are face to face or around the globe. Customizable templates and workflows keep discussions focused on objectives, helping you drive actionable outcomes each and every time.
Frequently asked questions
What are the four quadrants of the BCG matrix?
Why is it called the Boston matrix?
What is an example of a BCG matrix for a company?
What is the difference between the BCG matrix and a SWOT analysis?
What are the limitations of the BCG matrix?
Is the BCG matrix still relevant today?
How to run it in GroupMap

Brainstorm
Pre-populate items or ask everyone to add the products they want to consider under each quadrant.

Position
Identify the products in your portfolio, then position each one on the matrix by market share and growth.

Share
Agree the actions for each product, then share the outcomes and action plan with stakeholders.
Ready to get everyone on the same page?
Start a free GroupMap and turn your next discussion into clear, shared decisions.