GE-McKinsey Matrix
The GE-McKinsey matrix is a nine-box grid that ranks business units by industry attractiveness and competitive strength. See a worked example and build yours.
What is the GE-McKinsey matrix?
The GE-McKinsey matrix is a strategic portfolio tool that plots a company’s business units on a 3×3 nine-box grid, with industry attractiveness on one axis and competitive strength on the other, to decide where to invest, where to hold, and where to harvest or divest. It is often called the nine-box matrix or the GE matrix.
Developed by McKinsey & Company for General Electric in the early 1970s, it was created as a more sophisticated alternative to the BCG matrix. Instead of two simple metrics, each axis is a weighted score of several underlying factors, so a business unit’s position reflects a fuller picture of the market it competes in and its ability to win there.
Key takeaways
- The GE-McKinsey matrix is a 3×3 grid: industry attractiveness × competitive strength.
- Both axes are weighted, multi-factor scores, not single metrics like the BCG matrix.
- Nine cells resolve into three strategies: invest/grow, selectivity, harvest/divest.
- It gives a richer read than BCG but needs more data and judgement to build.
- It works best as a group exercise so factor weights and scores are agreed, not imposed.
The nine boxes explained
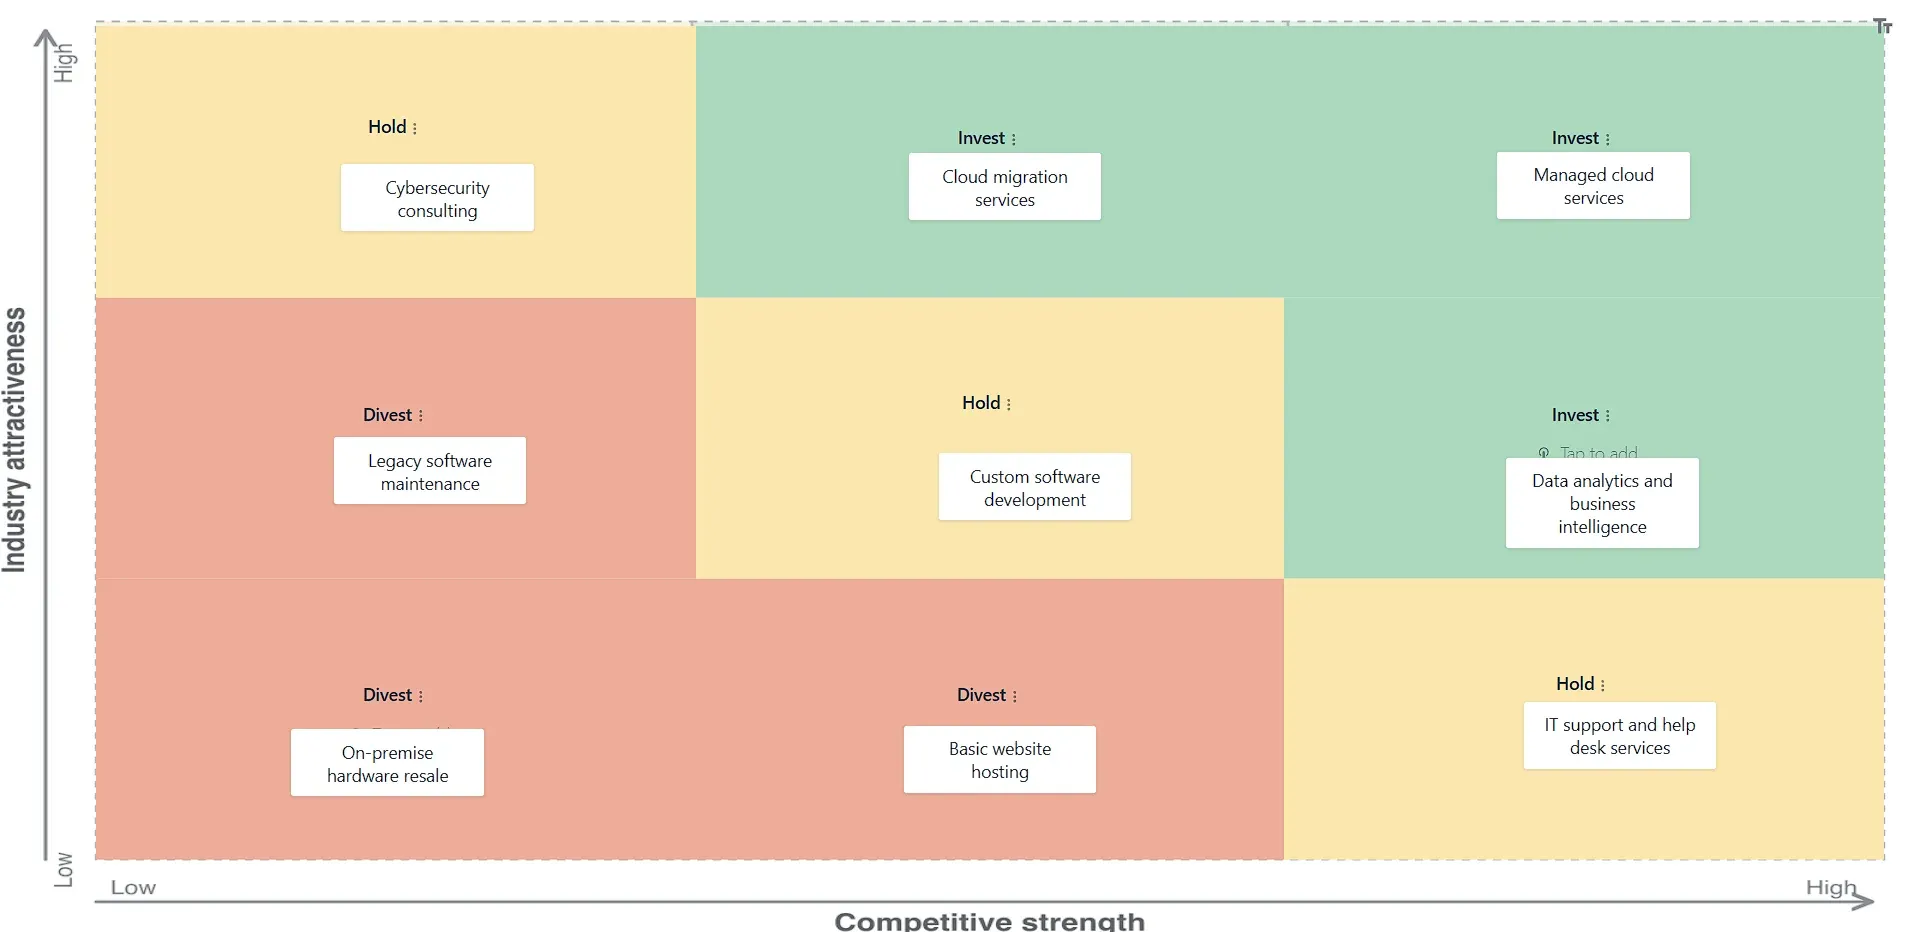
The two axes each run low, medium and high, creating nine cells. Position determines the broad strategy:
| Low competitive strength | Medium competitive strength | High competitive strength | |
|---|---|---|---|
| High industry attractiveness | Selectivity: build selectively | Invest: grow | Invest: grow (protect leader) |
| Medium industry attractiveness | Harvest: limited expansion | Selectivity: manage for earnings | Invest: build selectively |
| Low industry attractiveness | Harvest / divest | Harvest: manage for earnings | Selectivity: protect and refocus |
- Green cells (invest / grow): attractive markets where you are strong. Prioritize funding, grow share and defend the position.
- Yellow cells (selectivity): a mixed picture. Invest selectively in the units that can win, and manage the rest for earnings.
- Red cells (harvest / divest): weak position in an unattractive market. Minimize investment, harvest cash, or exit.
How to score the two axes
Each axis is a weighted composite, not a single number. A typical approach:
- Industry attractiveness: market size, growth rate, profit margins, competitive intensity, regulatory or macro trends. Weight each factor by importance, score every unit’s market, and sum to a weighted total.
- Competitive strength: relative market share, brand equity, cost position, product quality, distribution reach, technical capability. Weight, score and total the same way.
Doing this openly with a group is what makes the tool reliable. When people agree the factors and weights up front, the resulting positions carry far more credibility than one analyst’s spreadsheet.
Why use the GE-McKinsey matrix?
- It gives a more nuanced portfolio view than a two-metric model, capturing several drivers per axis.
- It links directly to resource-allocation decisions, telling you where the next dollar of investment should go.
- The weighting step forces an explicit conversation about what “attractive” and “strong” actually mean for your business.
- It visualizes the whole portfolio on one page, making trade-offs between units easy to see.
Who should use the GE-McKinsey matrix?
The nine-box is aimed at corporate strategists, executives and portfolio managers in multi-business or multi-product organizations. It is most valuable when capital is scarce and leadership must choose which units to back and which to wind down. Single-product companies will get more from a SWOT analysis or a competitive perceptual map.
GE-McKinsey matrix example
Consider a consumer-goods company reviewing three divisions:
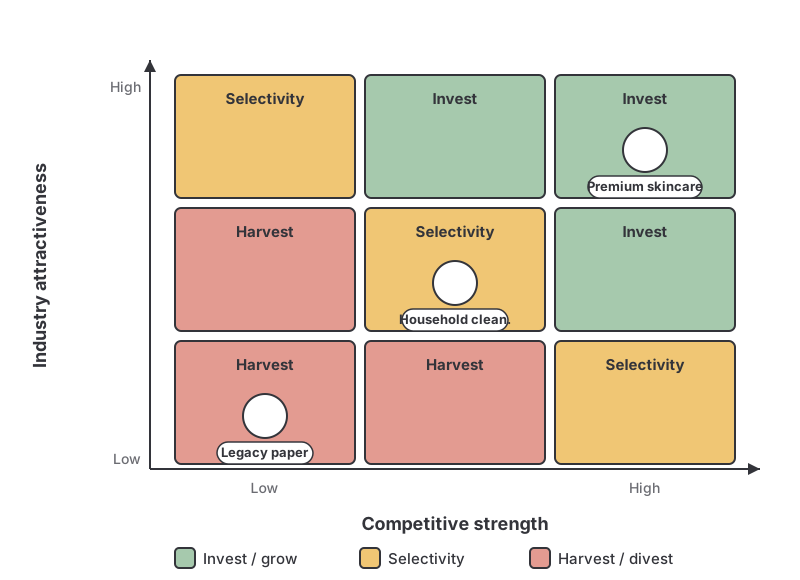
- Premium skincare: a large, fast-growing, high-margin market (high attractiveness) where the company holds a strong brand and leading share (high strength). It lands in a green cell: invest and grow.
- Household cleaning: a mature, low-growth, price-competitive market (low attractiveness) where the company is a mid-tier player (medium strength). It lands on the diagonal: selectivity, manage for earnings.
- Legacy paper products: a declining market (low attractiveness) where the company is a weak, sub-scale competitor (low strength). It lands in a red cell: harvest or divest.
The value is the resulting decision: fund skincare aggressively, run cleaning for cash, and plan an exit from paper. That is a clear, shared allocation rather than spreading investment evenly.
How to run a GE-McKinsey analysis in GroupMap
The nine-box works best when the whole leadership team agrees the factors, weights and scores together rather than reviewing one person’s finished grid.
- Set the scope. List the business units, products or markets you are assessing.
- Agree the factors and weights. As a group, decide what drives industry attractiveness and competitive strength, and how much each factor counts.
- Brainstorm and score. Add each unit, then rate it against every factor to build weighted axis totals.
- Position on the grid. Place each unit in its cell, sizing bubbles by revenue if that helps.
- Discuss and align. Debate any placements the group disagrees on until you reach a shared view.
- Agree actions and share. Turn each invest / hold / harvest call into an action plan and distribute it.
Limitations of the GE-McKinsey matrix
- The factor weighting and scoring are subjective, so different groups can produce different placements.
- It analyzes units in isolation and ignores synergies, shared capabilities or cannibalization between them.
- It is data-hungry and slower to build than a simple 2×2, which can be overkill for a small portfolio.
- Like all snapshots, it dates quickly. Attractiveness and strength shift, so revisit it periodically.
Related templates
References
Make the nine-box a shared decision with GroupMap
The GE-McKinsey matrix is only as good as the conversation behind its scores, and GroupMap is built for that conversation. Everyone can propose factors, weight them and position units at once, private input reduces groupthink, and the live grid shows instantly where the leadership team agrees and where it does not. Customizable templates and workflows keep the discussion anchored to the allocation decision, so you leave with an agreed portfolio strategy rather than one executive’s view.
Frequently asked questions
What is the GE-McKinsey matrix?
What is the difference between the GE-McKinsey matrix and the BCG matrix?
What do the nine boxes mean?
How do you measure industry attractiveness and competitive strength?
What are the limitations of the GE-McKinsey matrix?
How to run it in GroupMap

Brainstorm
Pre-populate the business units or ask everyone to add the units, products or markets the team wants to assess.

Position
Place each business unit on the grid by industry attractiveness and competitive strength, sizing bubbles by revenue where useful.

Rate
Score the underlying factors behind each axis so positions reflect weighted evidence, not gut feel alone.

Results
Agree the invest, hold or harvest decision for each unit, then share the outcome and action plan with stakeholders.
Ready to get everyone on the same page?
Start a free GroupMap and turn your next discussion into clear, shared decisions.